AUD/USD Weekly Forecast: Bulls would need help from the RBA
- The market continues to ignore tensions between Canberra and Beijing.
- Australia has once again controlled the pandemic, with no new cases in Victoria for three weeks.
- AUD/USD is technically bullish and poised to extend its advance to fresh yearly highs.

The Australian dollar is at its highest since September 1 against its American rival and not far from the 2020 high of 0.7413. The AUD advantaged the greenback as the investors dumped the latter in benefit of high-yielding assets.
US equities rallied to record highs after US President Donald Trump agreed to begin the transition with President-elect Joe Biden´s staff, also after upbeat US Markit PMIs. However, enthusiasm faded as the week went by, as other macroeconomic data failed to impress, while coronavirus concerns arose.
Pandemic under control in Australia
Australia has once again controlled coronavirus. Victoria has registered three weeks without new cases and deaths, while the latest outbreak in South Australia also came under control without new contagions. On the contrary, the virus spread has accelerated in the US, with record hospitalizations in the country and the death toll nearing 270K.
The market keeps ignoring tensions between Beijing and Canberra, which may take a toll on Australian economic growth. The latest on the issue is that China has announced it would implement tariffs on the Australian wine industry as an anti-dumping measure. The Chinese government has been banning imports of multiple Australian products in the last few months after Australia jointed an investigation over the origins of COVID-19.
RBA, Q3 GDP and more
The US economy continues to grow, according to the data released this week. Still, the numbers failed to impress. Beyond the upbeat Markit PMIs, the US reported a contraction in Consumer Sentiment, down to 76.9 in November according to Michigan University. Also, the Q3 GDP in the US was confirmed at 33.1% annualized, worse than the expected revision upwards, while Initial Jobless Claims for the week ended November 20 jumped to 778K. Durable Goods Orders, on the other hand, improved by 1.3% in October.
Australia had quite a light week, as the only relevant report published was the Commonwealth Bank PMIs, which showed that services output and manufacturing activity both improved in November, according to preliminary estimates. The October Trade Balance posted a surplus of 4840M, worse than the previous but still solid.
The US will unveil next week the November ISM PMIs and the Nonfarm Payroll monthly report. The country is expected to have added 520K new job positions in November, while the unemployment rate is expected at 6.8%.
The Australian macroeconomic calendar includes November TD Securities Inflation figures, the RBA Monetary Policy decision and Q3 Gross Domestic Product. Economic growth is expected to have contracted by 7.8% in the three months to September. China will publish the November official NBS PMIs, with growth seen contracting but holding in expansion territory.

AUD/USD technical outlook
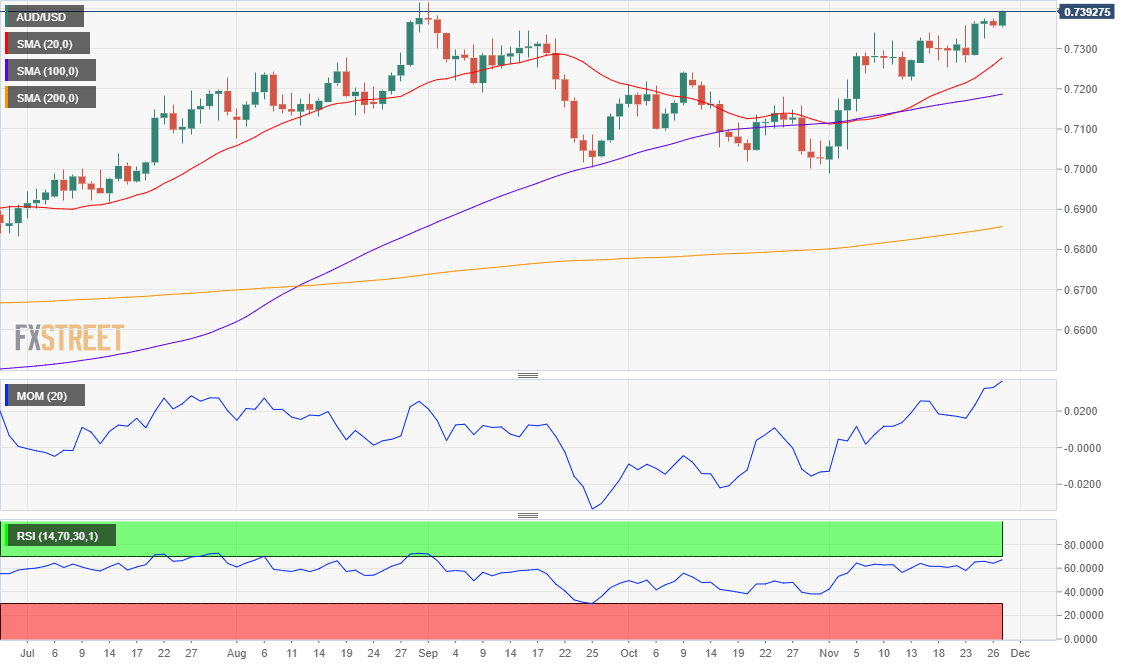
The AUD/USD pair trades near the year high and seems to have recovered part of its long-term bullish momentum. The weekly chart shows that it held above the 200 SMA, while the 20 SMA is advancing just a tad below. Technical indicators extended their advances within positive levels, with the RSI at 62, its highest in two months.
Daily basis, the bullish case is also firmly anchored. The AUD/USD pair advanced above all of its moving averages, with the 20 SMA accelerating north above the longer ones. The Momentum indicator turned flat within positive levels amid limited intraday ranges this week. Still, a bullish breakout seems likely.
0.7413 is the immediate resistance level ahead of the 0.7470 region, where the pair posted multiple intraday highs back in 2018. Beyond this last, the next relevant level is 0.7520. A critical support level comes at 0.7250, with a break below it favoring a bearish corrective decline that can extend towards 0.7100.
AUD/USD sentiment poll
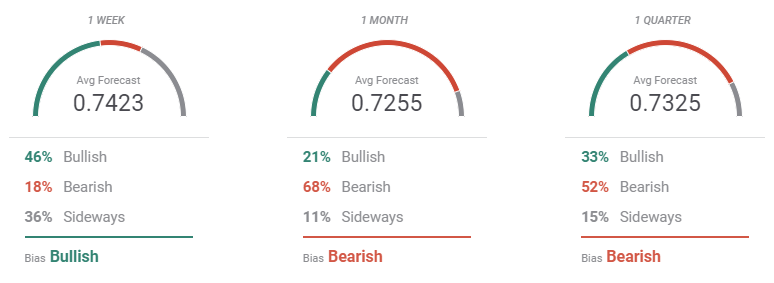
The FXStreet Forecast Poll indicates that the pair could extend its advance in the near-term, but substantial gains in the longer-run are still on hold. Most polled experts seen the pair falling in the monthly and quarterly views, although in both cases holding above 0.7200 on average.
The Overview chart contradicts sentiment. The three moving averages are bullish, with only the monthly one showing limited strength. The pair has more chances of hitting 0.7600 than breaking below 0.7000, according to the same chart.
Related Forecasts:
EUR/USD Weekly Forecast: All spin and no delivery, poised to challenge 1.2000
GBP/USD Weekly Forecast: Brexit, Powell and Nonfarm Payrolls promise a hectic start to December
Premium
You have reached your limit of 3 free articles for this month.
Start your subscription and get access to all our original articles.
Author

Valeria Bednarik
FXStreet
Valeria Bednarik was born and lives in Buenos Aires, Argentina. Her passion for math and numbers pushed her into studying economics in her younger years.


