|

A little juice for the oversold bounce

S&P 500 ran higher after the opening bell as expected, and UoM data also came in stagflationary as called, yet rolling over to the downside through 5,660s was rejected – and short squeeze had developed, another much awaited daily one (can go on a bit longer in time than that). In terms of sectors, it was a risk-on day, however daily volume was unconvincing even if 90% of stocks advanced. I‘m discussing market breadth and volatility takeways as to where we are in this S&P 500 and Nasdaq bottoming, in the extensive weekend video.

Therein, I also put into context sectoral performance on a weekly basis, talk weekly and daily S&P 500 charts with yields path prospect – more information as always follows in the premium section for clients, but do review the 25min video, it‘s packed with actionable insights.

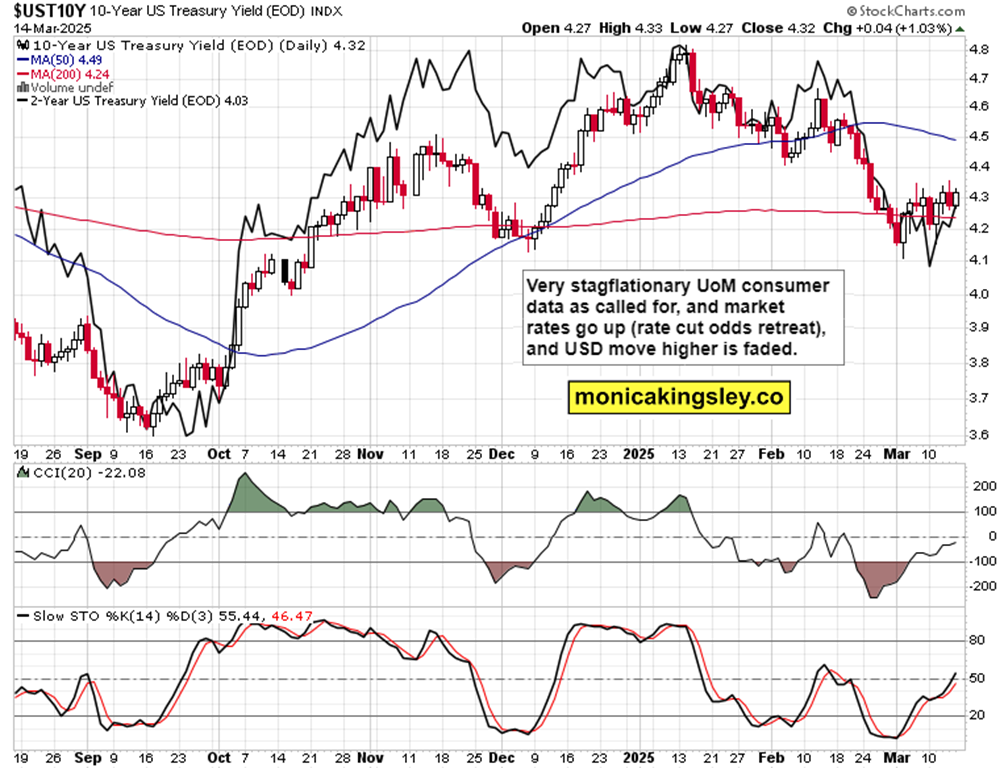
A couple of tweets for starters – together with yields chart and very tame USD retracement to the upside as rates around the world are rising faster. Little wonder that gold and silver continued surging higher, and midweek I started favoring silver more – lot of catching up to do as it goes on to challenge $35 Oct highs, and I do favor a break higher. Copper also has a great 2025 run, and will be over $5 in no time – plenty of action and positioning for Trading Signals clients (very short-term outlooks issued), regardless of the stagflationary data whiff that led also to 30% recession odds for 2025.

Jittery consumer (expecting inflation which though had been revealed as tame with CPI and PPI readings called out for you as such) means going in cautiously into retail sales announcement, and also retailers with leisure stocks suffering. Not even defensives worked in the week (except for utilities, we know why), which is what I talked about in earlier videos (thanks to high VIX, defensives don‘t work).

Today‘s retail sales and manufacturing data came in as predicted (disappointment), and technical oversold bounce can continue for a while longer – all discussed in today‘s video covering the premarket moves too.

Chart

Author

Monica Kingsley

Monica Kingsley

Monicakingsley

Monica Kingsley is a trader and financial analyst serving countless investors and traders since Feb 2020.

More from Monica Kingsley
Share:

Markets move fast. We move first.

Orange Juice Newsletter brings you expert driven insights - not headlines. Every day on your inbox.

By subscribing you agree to our Terms and conditions.

Editor's Picks

EUR/USD edges higher to mid-1.1600s; looks to US PCE Price Index for fresh impetus

The EUR/USD pair attracts some dip-buyers during the Asian session on Friday and recovers a part of the previous day's retracement slide from the 1.1680 region, or the highest level since October 17. Spot prices currently trade around mid-1.1600s and remain on track to register gains for the second straight week.

GBP/USD: Constructive view prevails above 1.3300 ahead of US PCE inflation data

The GBP/USD pair trades on a flat note near 1.3330 during the Asian trading hours on Friday. Traders prefer to wait on the sidelines ahead of the key US inflation report later on Friday. The US delayed Personal Consumption Expenditures Price Index report for September could offer some hints about the US interest rate path.

Gold flat lines above $4,200 mark; looks to US PCE Price Index for some meaningful impetus

Gold struggles to capitalize on the overnight bounce from the $4,175 area, or the vicinity of the weekly trough, and oscillates in a narrow trading range during the Asian session on Friday. Traders now seem reluctant and opt to move to the sidelines ahead of the September Personal Consumption Expenditures Price Index, or the Federal Reserve's preferred inflation gauge. 

Pi Network: Bearish streak nears critical support trendline

Pi Network edges lower on Friday for the third consecutive day, approaching a local support trendline. The on-chain data suggests an increase in supply pressure as Centralized Exchanges experience a surge in inflows. Technically, the pullback in PI risks further losses, as the Moving Average Convergence Divergence indicator is flashing a sell signal. 

Why the Fed may cut rates in December: Understanding the policy shift

The Fed has gone through a noticeable policy swing in recent months - from initiating a rate cut, to signaling a potential pause, and now shifting once again toward another cut in December. This has created understandable confusion among traders and investors trying to interpret the Fed’s reaction function.

XRP edges lower despite record on-chain activity and steady ETF inflows

Ripple is trading under pressure at the time of writing on Thursday, after bulls failed to break the short-term resistance at $2.22. The reversal may extend toward Monday’s low of $1.98, especially if risk-off sentiment persists in the broader cryptocurrency market.