XPeng Stock News and Forecast: XPEV falls sharply on Li Auto delivery news
- XPEV stock falls sharply, down 7% on Wednesday.
- XPEV likely falls in response to delivery updates from peer LiAuto.
- Equities are set for more losses on Thursday.

Equities rose sharply on Wednesday, but the Chinese EV sector struggled. XPeng (XPEV) stock fell nearly 3%. Equities were helped by a pivot from the Bank of England, which set a fire under risk assets. The main indices closed nearly 2% higher, while the small-cap Russell 2000 was up over 3%.
XPEV stock news
XPEV was likely dragged lower by a delivery update from competitor LiAuto. LI stock fell also as it downgraded its outlook for deliveries in the third quarter. The firm said it will likely deliver 25,500, which is down from prior forecasts of a midpoint at 28,000. LiAuto blamed supply chain issues, a common theme for the past two years. As a result, this dragged down the whole Chinese EV sector with XPEV falling 2.8% and NIO closing higher by 0.8%.
That close for NIO though was still an underperformance versus the indices and Tesla. Now we note some sharper falls as risk sentiment once again darkens. XPEV is down 7% on Thursday's premarket. The stock is not flying then despite CNEVPost reporting that the company got the all-clear to launch the first flying car in Dubai.
XPEV stock forecast
The stock remains mired in a long-term downtrend, and that seems unlikely to change. Risk premia have turned sharply in favor of alternative assets, and high-growth stocks will struggle for momentum. On the daily chart, the break below $18.23 was significant, and this is the medium-term pivot. We do notice a bullish divergence so far in the Relative Strength Index (RSI), so this could be an early sign of a potential bottom. It is still too early but remains a signal to keep an eye on.
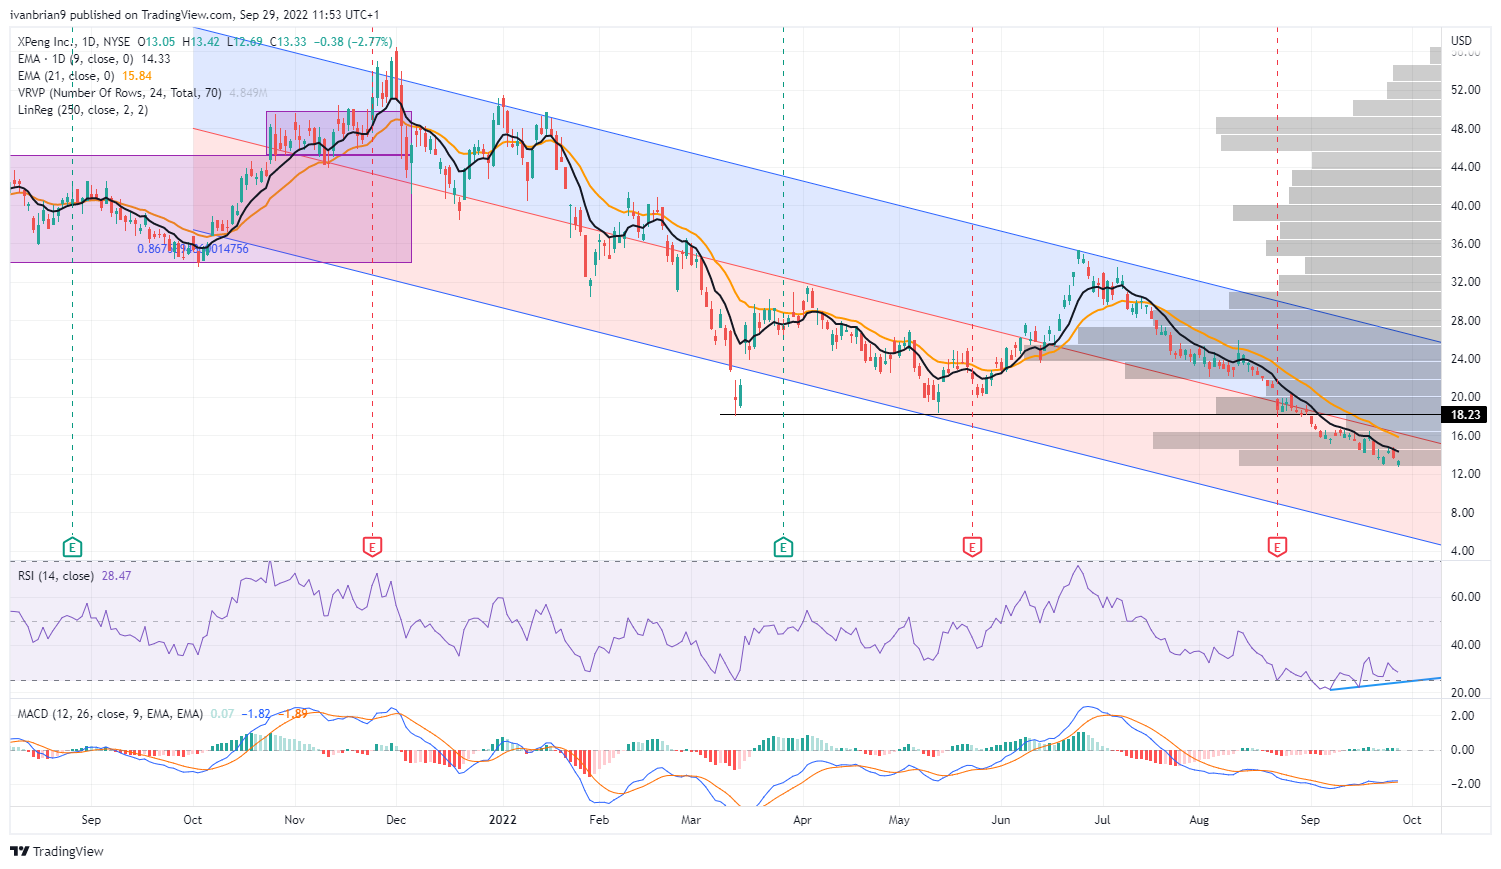
XPEV daily chart
On the hourly chart, we remain in the powerful downtrend channel. We need to keep an eye on the highlighted low as so far the RSI has held up. A fresh low should see the RSI lower. Alternatively, we could have bottomed and need a break of $14.80 to confirm a possible short-term bottom.
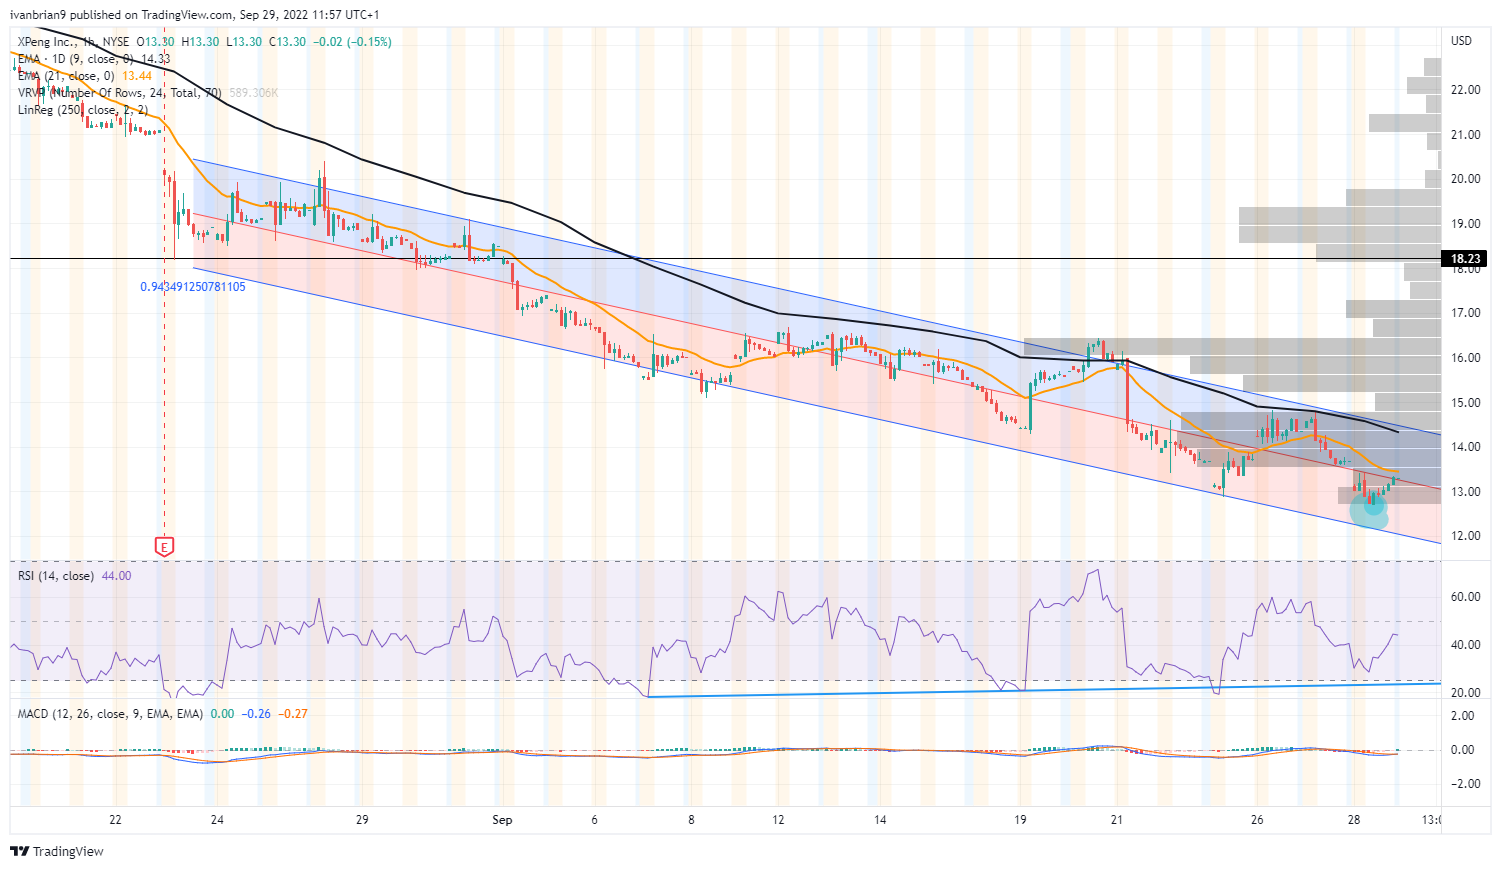
XPEV hourly chart
Author

Ivan Brian
FXStreet
Ivan Brian started his career with AIB Bank in corporate finance and then worked for seven years at Baxter. He started as a macro analyst before becoming Head of Research and then CFO.















