XAG/USD capped by key technicals as bullish momentum stalls
- Silver tests 50-day EMA resistance after volatile post-selloff recovery
- FOMC January minutes released Wednesday showed broad support for holding rates steady, with most participants cautioning that progress toward 2% inflation may be slower than expected.
- Geopolitical safe-haven flows from unresolved US-Iran nuclear talks and stalled Ukraine-Russia peace negotiations are providing a floor under Silver prices this week.

Fed funds rate expectations remains the key risk-driver for ebbing Spot Silver markets heading into the back half of February. The Federal Reserve (Fed) held rates at 3.50% to 3.75% at its January meeting, and the minutes released on Wednesday showed a divided committee leaning cautious on further easing. Most participants judged the risk of inflation running persistently above 2% as meaningful, though some noted rate cuts could become appropriate if disinflation continues.
Markets are pricing roughly 60 basis points of easing by year-end, but the Fed's data-dependent stance and the looming May leadership transition as Chair Powell's term expires are keeping rate expectations fluid.
Safe-haven demand from unresolved US-Iran tensions and stalled Ukraine-Russia peace talks in Geneva is lending some support, though a firmer US Dollar (USD) following the hawkish minutes tone is capping gains for dollar-denominated metals.
Choppy recovery stalls at the 50 EMA near 79.20
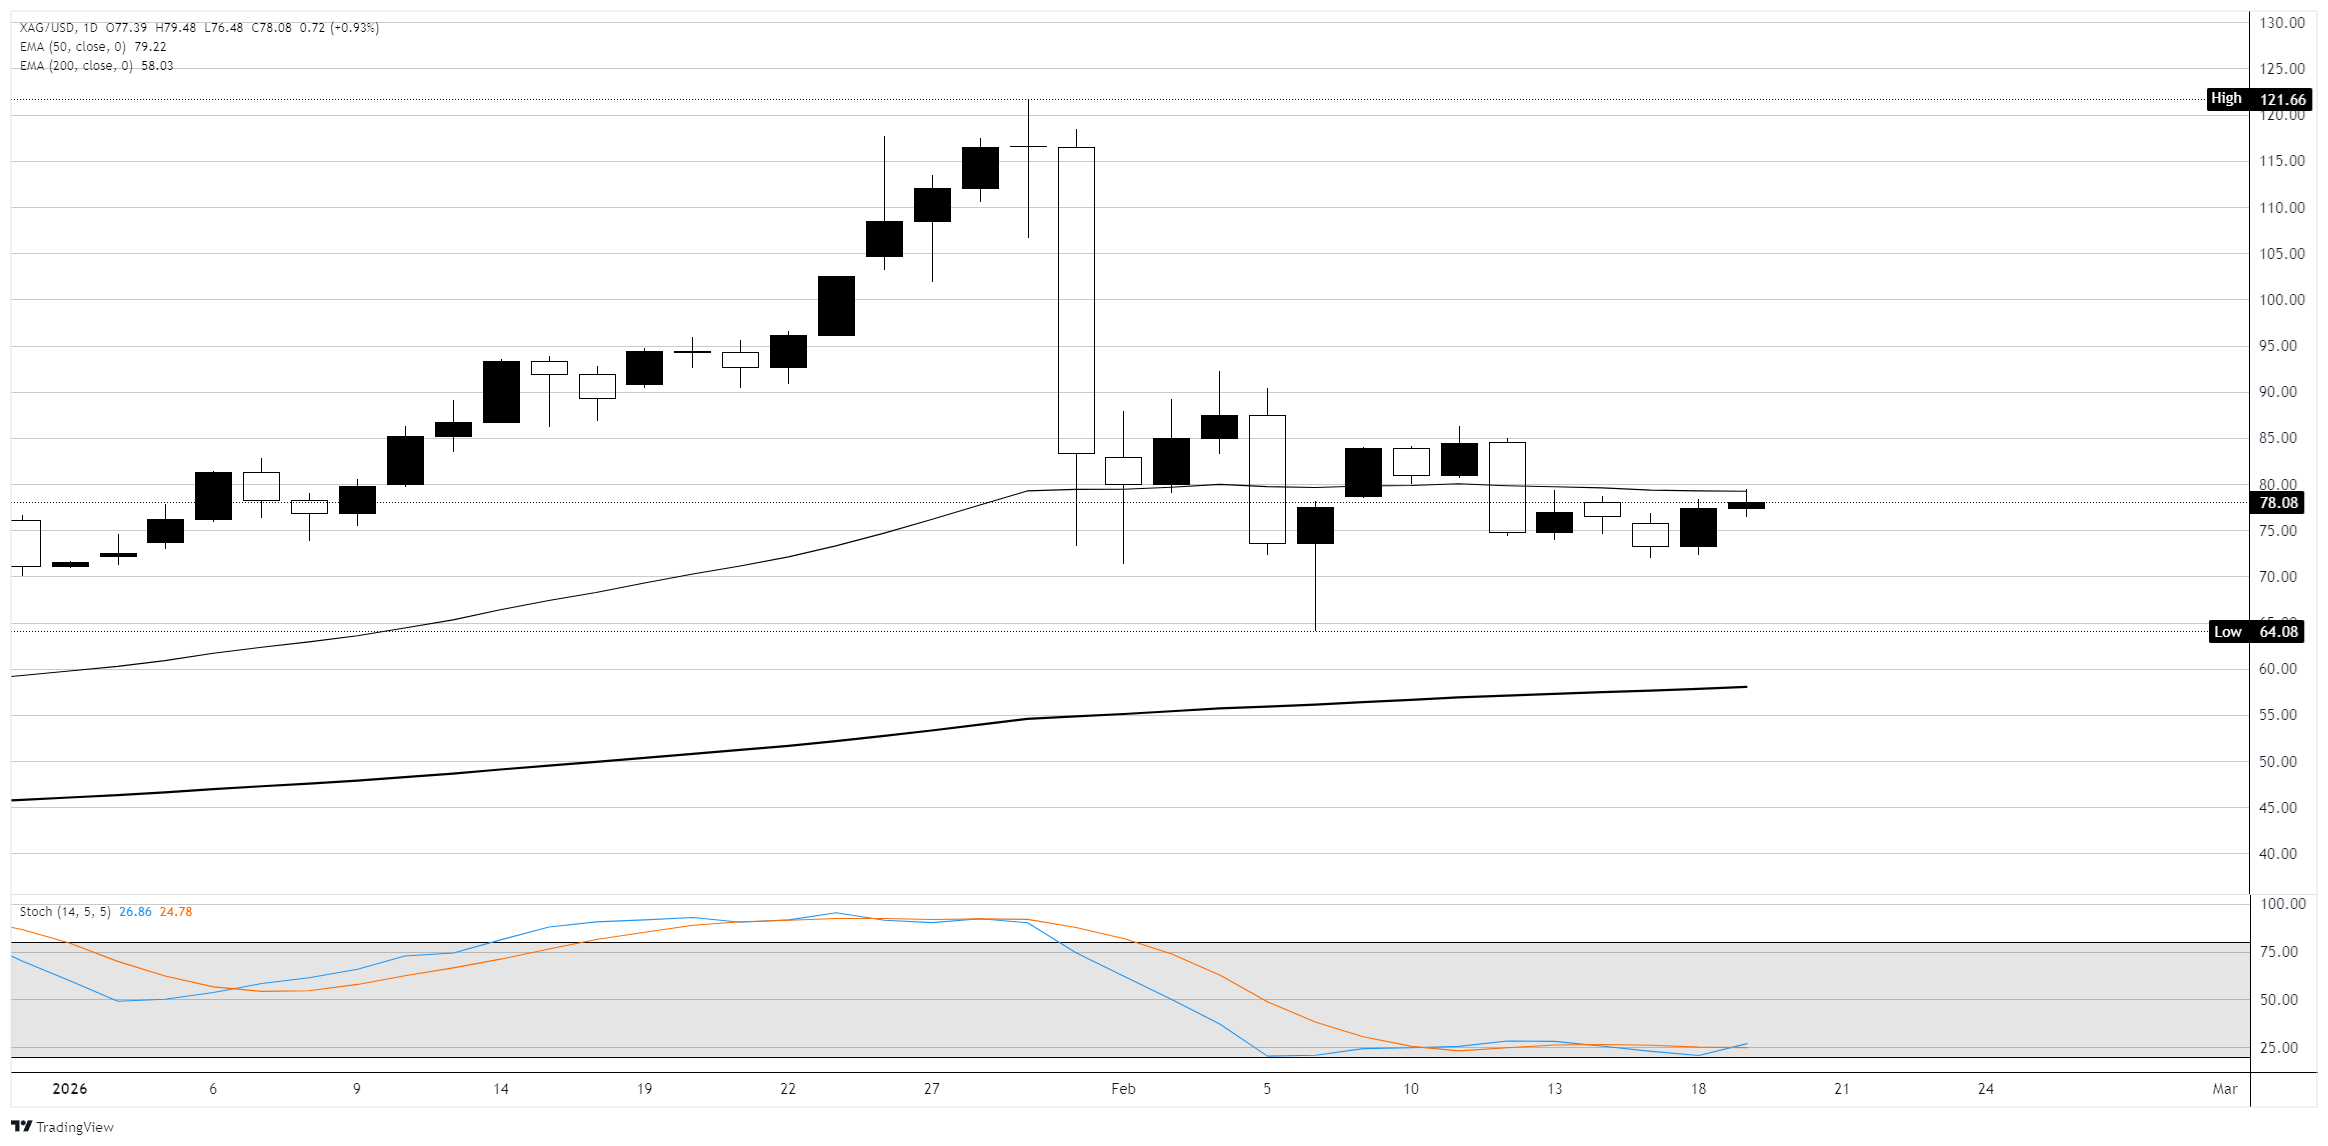
Spot Silver prices are trading just below the flattening 50-day Exponential Moving Average (EMA) at 79.22, which is acting as near-term resistance, while the 200-day EMA at 58.03 sits far below, confirming the broader uptrend remains in place, albeit waning. The recovery from the February 6 low at 64.08 has been choppy, with Silver reclaiming roughly half of the losses from the late-January spike before stalling into a range of small-bodied candles and doji around the 75 to 85 zone over the past two weeks.
The Stochastic Oscillator continues to sit near the oversold zone, suggesting downside momentum may be at its exhaustion limits. A sustained close above the 50 EMA at 79.22 would open the door toward resistance near 85.00, while failure to reclaim that level risks a pullback toward 75.00 and the February low at 64.00.
XAG/USD daily chart
Silver FAQs
Silver is a precious metal highly traded among investors. It has been historically used as a store of value and a medium of exchange. Although less popular than Gold, traders may turn to Silver to diversify their investment portfolio, for its intrinsic value or as a potential hedge during high-inflation periods. Investors can buy physical Silver, in coins or in bars, or trade it through vehicles such as Exchange Traded Funds, which track its price on international markets.
Silver prices can move due to a wide range of factors. Geopolitical instability or fears of a deep recession can make Silver price escalate due to its safe-haven status, although to a lesser extent than Gold's. As a yieldless asset, Silver tends to rise with lower interest rates. Its moves also depend on how the US Dollar (USD) behaves as the asset is priced in dollars (XAG/USD). A strong Dollar tends to keep the price of Silver at bay, whereas a weaker Dollar is likely to propel prices up. Other factors such as investment demand, mining supply – Silver is much more abundant than Gold – and recycling rates can also affect prices.
Silver is widely used in industry, particularly in sectors such as electronics or solar energy, as it has one of the highest electric conductivity of all metals – more than Copper and Gold. A surge in demand can increase prices, while a decline tends to lower them. Dynamics in the US, Chinese and Indian economies can also contribute to price swings: for the US and particularly China, their big industrial sectors use Silver in various processes; in India, consumers’ demand for the precious metal for jewellery also plays a key role in setting prices.
Silver prices tend to follow Gold's moves. When Gold prices rise, Silver typically follows suit, as their status as safe-haven assets is similar. The Gold/Silver ratio, which shows the number of ounces of Silver needed to equal the value of one ounce of Gold, may help to determine the relative valuation between both metals. Some investors may consider a high ratio as an indicator that Silver is undervalued, or Gold is overvalued. On the contrary, a low ratio might suggest that Gold is undervalued relative to Silver.
Author

Joshua Gibson
FXStreet
Joshua joins the FXStreet team as an Economics and Finance double major from Vancouver Island University with twelve years' experience as an independent trader focusing on technical analysis.

















