|

WTI Technical Analysis: “Rising Wedge” breakout in place, initially targeting $51.10
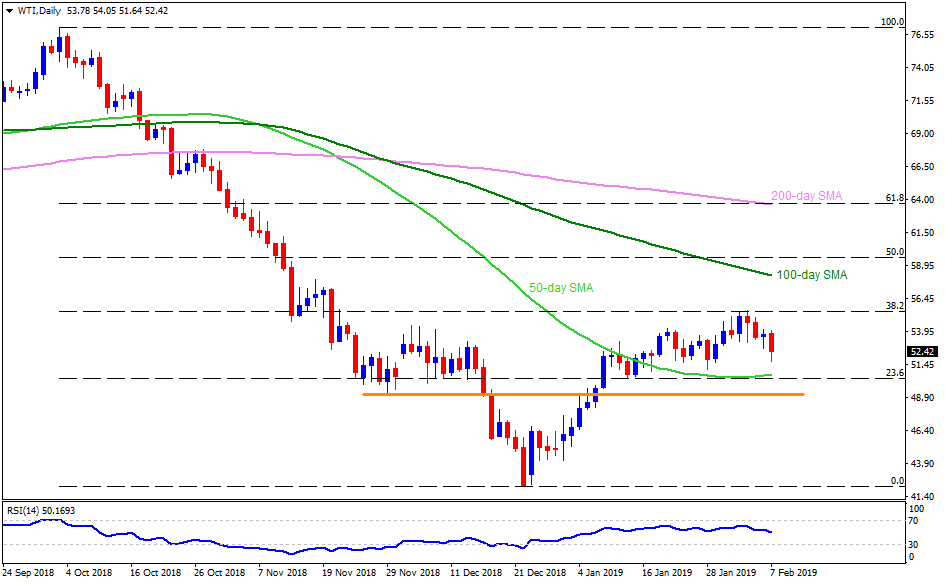
WTI daily chart

  • Failure to surpass 38.2% Fibonacci Retracement of its October to December 2018 downturn highlights the importance of two-week low of $51.10, breaking which 50-day simple moving average (SMA) figure of $50.60 can gain market attention.
  • In case prices refrain to respect $50.60 level, the $50.00 mark, and the $49.10-$49.00 horizontal-area may become next support to watch.
  • On the upside, a closing break of $55.45, comprising 38.2% Fibonacci, could accelerate the upmoves to 100-day SMA level of $58.20.
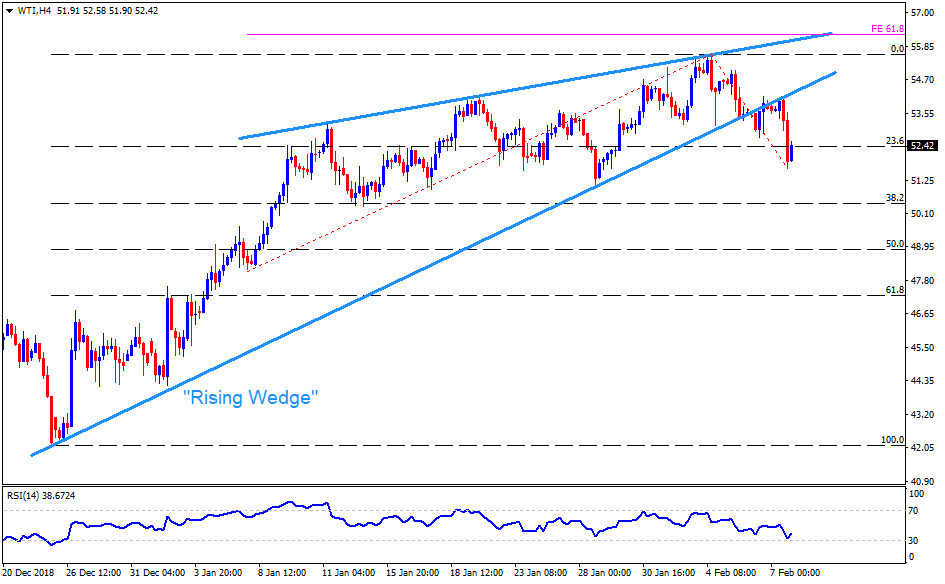
WTI 4-hour chart

  • “Rising Wedge” break signals further declines of the WTI.
  • It can take rest at $51.10 initially to confirm further declines to $50.60 and the $50.30 supports.
  • Alternatively, $54.15 and $55.00 are likely nearby resistances to watch before highlighting $55.45 upside barrier.
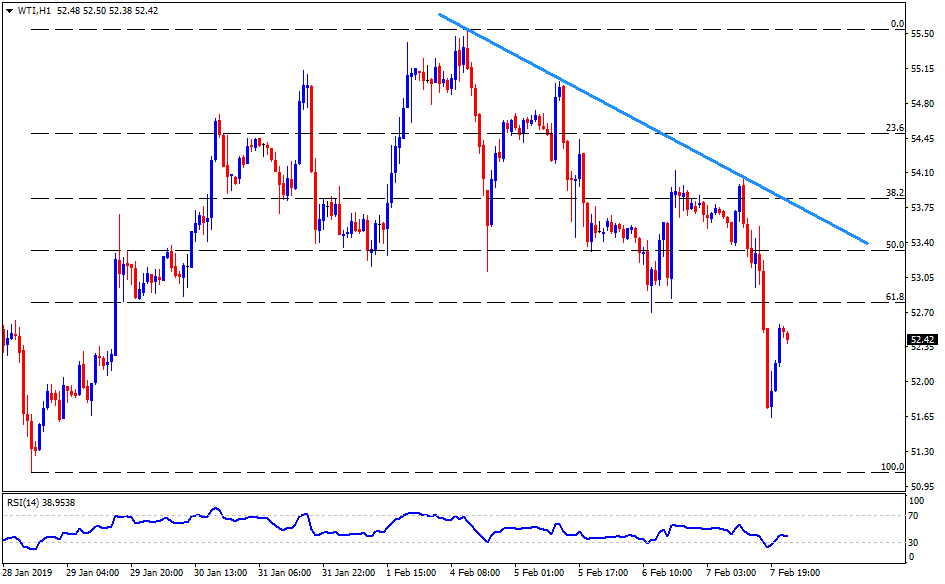
WTI 1-hour chart

  • Inability to sustain recent pullback past-$52.60 portrays the weakness.
  • $51.60 becomes a small halt prior to visiting the low of $51.10.
  • Meanwhile, a break of $52.60 can have $53.15 and a downward sloping trend-line at $53.85 as nearby resistances to watch.

Author

Anil Panchal

Anil Panchal

FXStreet

Anil Panchal has nearly 15 years of experience in tracking financial markets. With a keen interest in macroeconomics, Anil aptly tracks global news/updates and stays well-informed about the global financial moves and their implications.

More from Anil Panchal
Share:

Editor's Picks

EUR/USD struggles to regain momentum in the low1.1600s

EUR/USD is giving some signs of life in the aftermath of two severe days of losses on Wednesday, reclaiming the 1.1600 hurdle and above on the back of the resurgence of a mild selling bias around the US Dollar. Moving forward, the usual US weekly Claims will take centre stage on Thursday ahead of Friday’s crucial NFP data.
 

GBP/USD tests key moving averages as growth downgrade weighs

GBP/USD was nearly flat on Wednesday, edging up 0.08% to settle around 1.3370 in a quiet session. The pair has fallen sharply from its late-January high near 1.3870 and is now testing the 200-day Exponential Moving Average, with this week's one-week forex heatmap showing Pound Sterling as one of the worst performers against the US Dollar, down about 1.4% on the week.

Gold benefits from a retreating USD; reduced Fed rate cut bets cap gains

Gold attracts some buyers for the second consecutive day on Thursday amid a modest US Dollar pullback from an over three-month high, though it remains below the $5,200 mark. Wednesday's upbeat US macro data further tempered hopes for three rate cuts by the Fed in 2026. Furthermore, escalating Middle East tensions might continue to benefit the USD's status as the global reserve currency and contribute to capping the bullion.

Morgan Stanley files amended S-1 for spot Bitcoin ETF

Morgan Stanley submitted an amended S-1 filing to the US Securities and Exchange Commission on Wednesday, providing additional details on its proposed Bitcoin exchange-traded fund.

First Venezuela, now Iran: The US-China energy war escalates

At first glance, the latest escalation involving the United States with both Iran and Venezuela looks like another chapter in a long-running geopolitical story. But viewed through a broader strategic lens, something else may be unfolding: Energy.

Bittensor extends recovery despite retail demand slump

Bittensor, a leading Artificial Intelligence token, is aging up above $190 at the time of writing on Wednesday. Steady price increases characterise the broader crypto market, with Bitcoin holding above $71,000 and Ethereum above $2,000.