|

WTI Technical Analysis: Near-term bounce towards $54.00 unlikely to survive

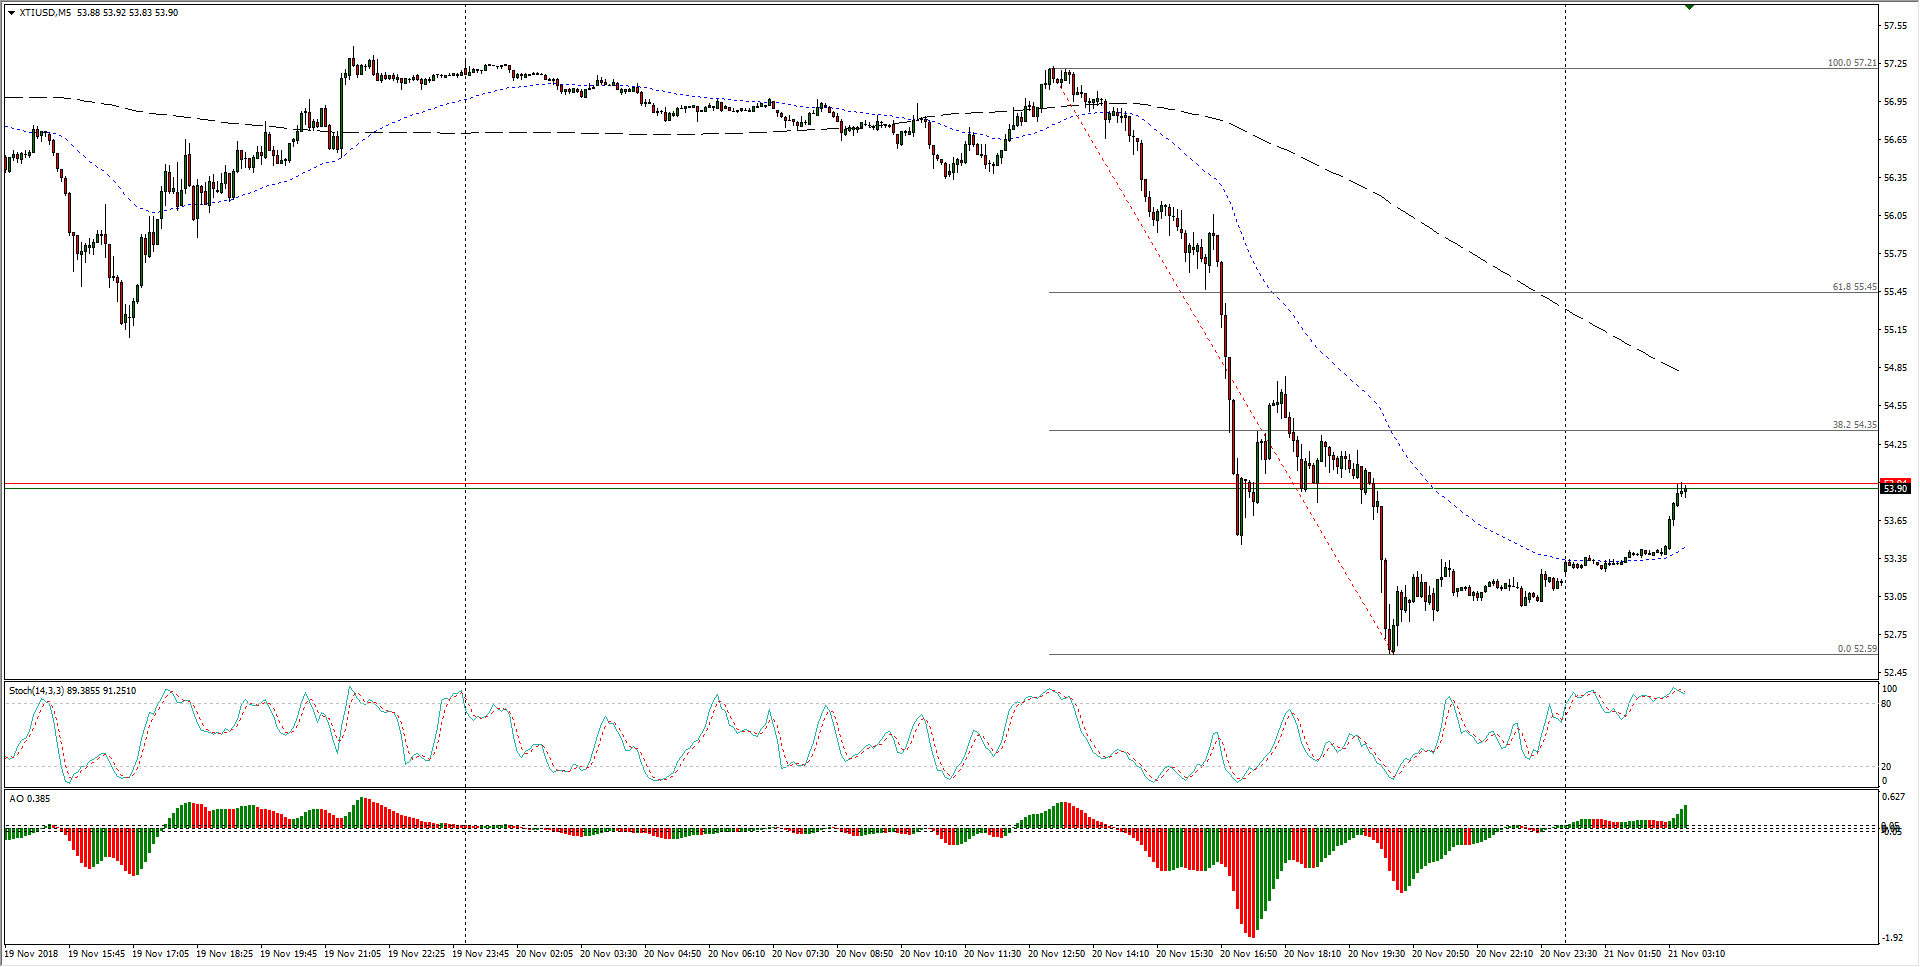
  • The last twenty-four hours saw US crude oil prices slip into touching distance of 52.00, a critical low for WTI, and Wednesday's early-session bounce from Tuesday's bottoms is set to hit intraday resistance at the 38.2 Fibo retracement level at 54.35.

WTI Chart, 5-Minute

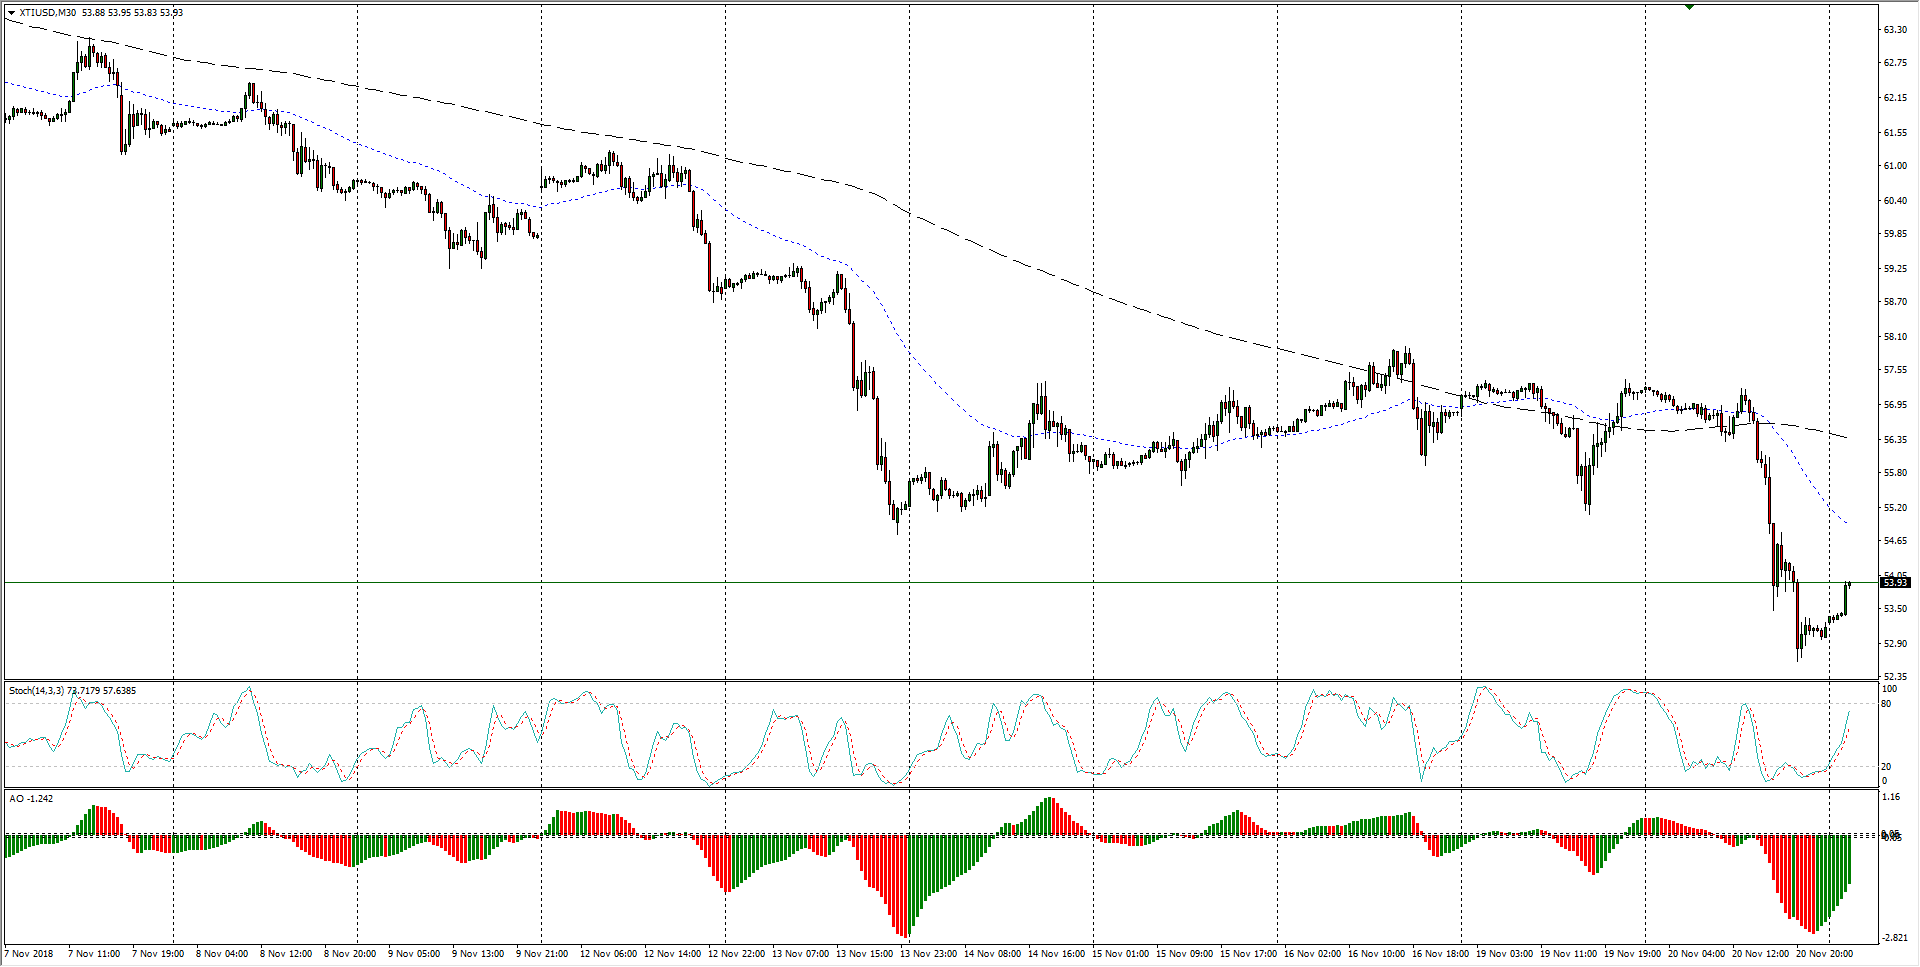
  • The last two weeks have seen US crude prices fail to establish a bullish recovery from the last low set on November 13th at 54.75, and after several days of muted gains US crude barrels are back on the decline.

WTI Chart, 30-Minute

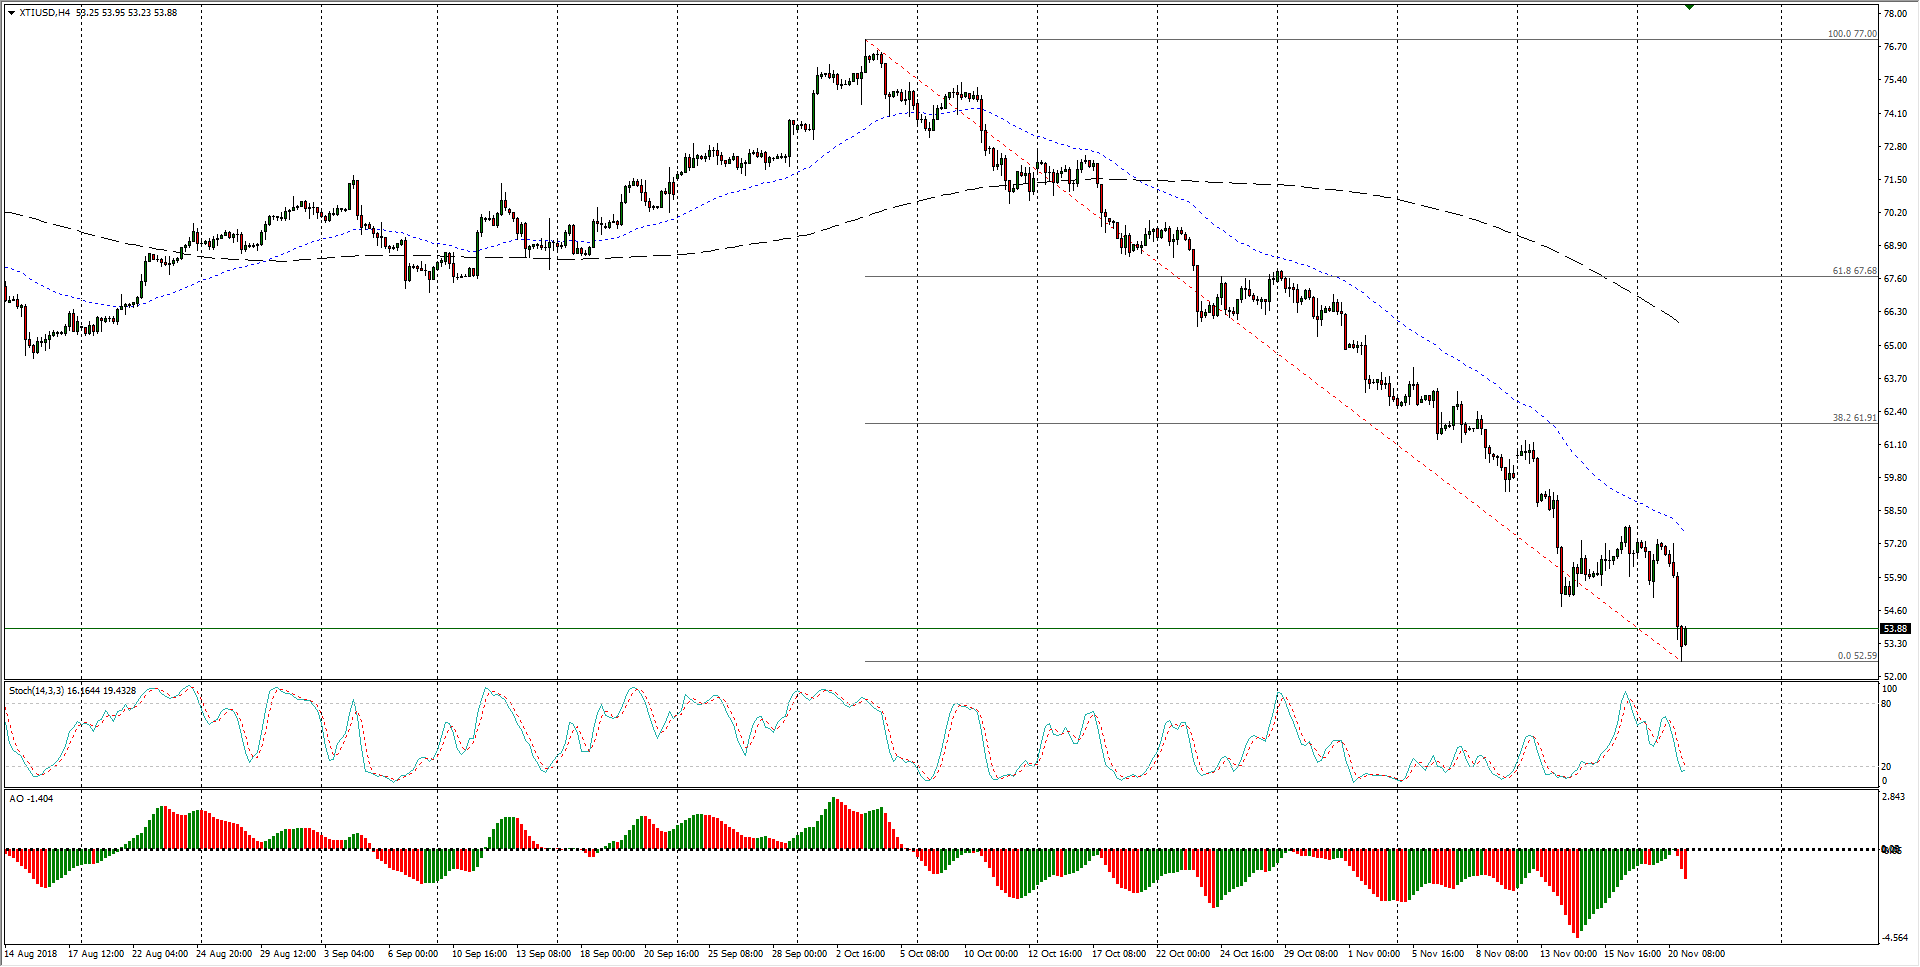
  • WTI's last quarter has seen a complete reversion into a bearish trend, and even a bounce into the 62.00 region would see US crude still stuck in a bearish chart stance after tumbling for what is now set to become a seven-week bear run.

WTI Chart, 4-Hour

WTI

Overview:
    Last Price: 54.03
    Daily change: 58 pips
    Daily change: 1.09%
    Daily Open: 53.45
Trends:
    Daily SMA20: 60.35
    Daily SMA50: 67.07
    Daily SMA100: 67.75
    Daily SMA200: 68.14
Levels:
    Daily High: 53.52
    Daily Low: 53.38
    Weekly High: 60.93
    Weekly Low: 55.21
    Monthly High: 76.25
    Monthly Low: 64.86
    Daily Fibonacci 38.2%: 53.47
    Daily Fibonacci 61.8%: 53.43
    Daily Pivot Point S1: 53.38
    Daily Pivot Point S2: 53.31
    Daily Pivot Point S3: 53.24
    Daily Pivot Point R1: 53.52
    Daily Pivot Point R2: 53.59
    Daily Pivot Point R3: 53.66

Author

Joshua Gibson

Joshua joins the FXStreet team as an Economics and Finance double major from Vancouver Island University with twelve years' experience as an independent trader focusing on technical analysis.

More from Joshua Gibson
Share:

Editor's Picks

EUR/USD trims losses, back to 1.1830

EUR/USD manages to regain some composure, leaving behind part of the earlier losses and reclaim the 1.1830 region on Tuesday. In the meantime, the US Dollar’s upside impulse loses some momentum while investors remain cautious ahead of upcoming US data releases, including the FOMC Minutes.

GBP/USD bounces off lows, retargets 1.3550

After bottoming out just below the 1.3500 yardstick, GBP/USD now gathers some fresh bids and advances to the 1.3530-1.3540 band in the latter part of Tuesday’s session. Cable’s recovery comes as the Greenback surrenders part of its advance, although it keeps the bullish bias well in place for the day.

Gold remains offered below $5,000

Gold stays on the defensive on Tuesday, receding to the sub-$5,000 region per troy ounce on the back of the persistent move higher in the Greenback. The precious metal’s decline is also underpinned by the modest uptick in US Treasury yields across the spectrum.

Crypto Today: Bitcoin, Ethereum, XRP upside looks limited amid deteriorating retail demand

The cryptocurrency market extends weakness with major coins including Bitcoin (BTC), Ethereum (ETH) and Ripple (XRP) trading in sideways price action at the time of writing on Tuesday.

UK jobs market weakens, bolstering rate cut hopes

In the UK, the latest jobs report made for difficult reading. Nonetheless, this represents yet another reminder for the Bank of England that they need to act swiftly given the collapse in inflation expected over the coming months. 

Ripple slides to $1.45 as downside risks surge

Ripple edges lower at the time of writing on Tuesday, from the daily open of $1.48, as headwinds persist across the crypto market. A short-term support is emerging at $1.45, but a buildup of bearish positions could further weaken the derivatives market and prolong the correction.