|

WTI struggling to recapture $90 heading into the end of the week

  • WTI is strung up near $89.00/bbl after slipping off of recent highs.
  • US crude barrels briefly saw $92.00 in the midweek on continuing supply concerns.
  • Price pressures have eased heading into the weekend, but prices are set to continue rising.

West Texas Intermediary (WT) US crude oil is struggling to hold onto the $90.00 price level as Friday trading leaves crude oil barrels trading mostly flat for the day, briefly piercing the major handle before falling back to near where the day's trading began.

Crude oil prices are seeing strong support looking forward, with global supply set to leave oil demand chronically undersupplied for the near future. 

WTI US crude oil prices are up over 11% on the year, and have gained nearly 40% from the year's low at $64.31.

Market analysts broadly expect crude barrels to reach $100 in the future as global reserves of crude barrels dwindle away in what some experts calculate to be a 2 million bpd deficit in global production.

Ongoing production cuts to buoy crude prices towards the upside

Saudi Arabia and Russia have extended production cuts worth a combined 1.3 million bpd through the end of the year, bolstering prices across the globe and sending production facilities into a buying frenzy to eat up the expanded margins on oil accumulation, further constraining available supply.

WTI technical outlook

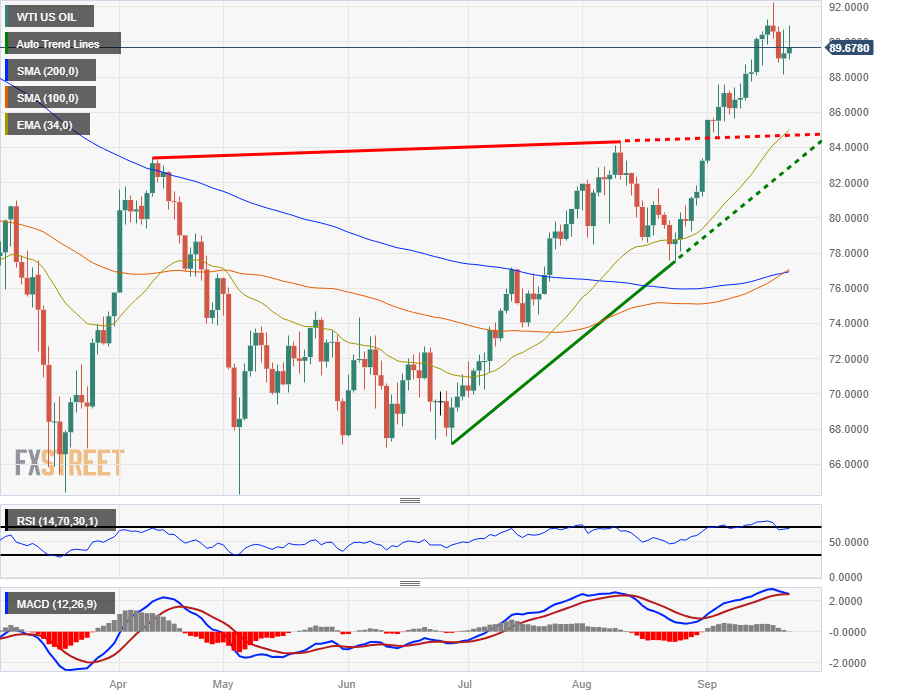
US crude oil has closed in the green for ten of the last twelve months. Daily candles see crude prices well above technical support, with the 200-day Simple Moving Average (SMA) near $77.00, well below current price action.

A rising trendline from late June's lows near $67.00 remains in place, and bullish momentum is currently running far away from the technical pattern.

The Relative Strength Index (RSI) and Moving Average Convergence-Divergence (MACD) indicators are both firmly planted in overbought territory, and it will take a significant profit-taking reversal to recover the indicator patterns.

WTI daily chart

WTI technical levels

WTI US OIL

Overview
Today last price89.6
Today Daily Change0.26
Today Daily Change %0.29
Today daily open89.34
 
Trends
Daily SMA2086.34
Daily SMA5082.31
Daily SMA10076.89
Daily SMA20076.87
 
Levels
Previous Daily High90.71
Previous Daily Low88.15
Previous Weekly High90.56
Previous Weekly Low86.23
Previous Monthly High84.32
Previous Monthly Low77.53
Daily Fibonacci 38.2%89.73
Daily Fibonacci 61.8%89.13
Daily Pivot Point S188.09
Daily Pivot Point S286.84
Daily Pivot Point S385.53
Daily Pivot Point R190.65
Daily Pivot Point R291.96
Daily Pivot Point R393.21

Author

Joshua Gibson

Joshua joins the FXStreet team as an Economics and Finance double major from Vancouver Island University with twelve years' experience as an independent trader focusing on technical analysis.

More from Joshua Gibson
Share:

Markets move fast. We move first.

Orange Juice Newsletter brings you expert driven insights - not headlines. Every day on your inbox.

By subscribing you agree to our Terms and conditions.

Editor's Picks

EUR/USD clings to small gains near 1.1750

Following a short-lasting correction in the early European session, EUR/USD regains its traction and clings to moderate gains at around 1.1750 on Monday. Nevertheless, the pair's volatility remains low, with investors awaiting this weeks key data releases from the US and the ECB policy announcements.

GBP/USD edges higher toward 1.3400 ahead of US data and BoE

GBP/USD reverses its direction and advances toward 1.3400 following a drop to the 1.3350 area earlier in the day. The US Dollar struggles to gather recovery momentum as markets await Tuesday's Nonfarm Payrolls data, while the Pound Sterling holds steady ahead of the BoE policy announcements later in the week.

Gold stuck around $4,300 as markets turn cautious

Gold loses its bullish momentum and retreats below $4,350 after testing this level earlier on Monday. XAU/USD, however, stays in positive territory as the US Dollar remains on the back foot on growing expectations for a dovish Fed policy outlook next year.

Solana consolidates as spot ETF inflows near $1 billion signal institutional dip-buying

Solana price hovers above $131 at the time of writing on Monday, nearing the upper boundary of a falling wedge pattern, awaiting a decisive breakout. On the institutional side, demand for spot Solana Exchange-Traded Funds remained firm, pushing total assets under management to nearly $1 billion since launch. 

Big week ends with big doubts

The S&P 500 continued to push higher yesterday as the US 2-year yield wavered around the 3.50% mark following a Federal Reserve (Fed) rate cut earlier this week that was ultimately perceived as not that hawkish after all. The cut is especially boosting the non-tech pockets of the market.

Solana Price Forecast: SOL consolidates as spot ETF inflows near $1 billion signal institutional dip-buying

Solana (SOL) price hovers above $131 at the time of writing on Monday, nearing the upper boundary of a falling wedge pattern, awaiting a decisive breakout.