|

WTI soars over 3% on growing optimist amidst US debt ceiling talks and IEA forecast

  • International Energy Agency predicts supply to fall behind demand by 2 million bpd in H2.
  • Positive developments in US debt ceiling talks boost market sentiment, lifting oil prices.
  • US crude oil prices rise despite increased inventories as China’s economic growth tempers.

Western Texas Intermediate (WTI) advanced more than 3% in the late New York session, exchanging hands at around the $72.90 area due to renewed optimism after UD debt ceiling negotiations pointed to an agreement. At the same time, the International Energy Agency (IEA) revealed that demand would outpace supply, bolstering oil prices.

Oil demand is set to outpace supply, while China accounts for 60% of the demand increase in 2023

The IEA revealed that supply would surpass demand by 2 million barrels per day (bpd) in the second half of the year, with China’s making up 60% of the oil demand increase in 2023.

In the meantime, US President Joe Biden commented that he’s confident about reaching a debt ceiling as he embarks on a trip to Japan. The US House Speaker Kevin McCarthy commented that he planned to be engaged in negotiations, while Biden said he planned to remain in close contact with the speaker and negotiators.

US crude oil prices defy the increase in US inventories, according to the US Energy Information Administration (EIA). Stockpiles rose 5 million barrels in the last week to 467.6 million barrels, compared to analysts’ expectations for a drop of 900K.

Aside from this, China’s recent economic data revealed that the economy is tempering its growth. According to sources cited by Reuters, “A bunch of Chinese macro-economic data for April released on Tuesday confirmed the narrative of a patchy and slow recovery in the country and continue to weigh on oil market sentiment.”

WTI Price Analysis: Technical outlook

WTI Daily chart

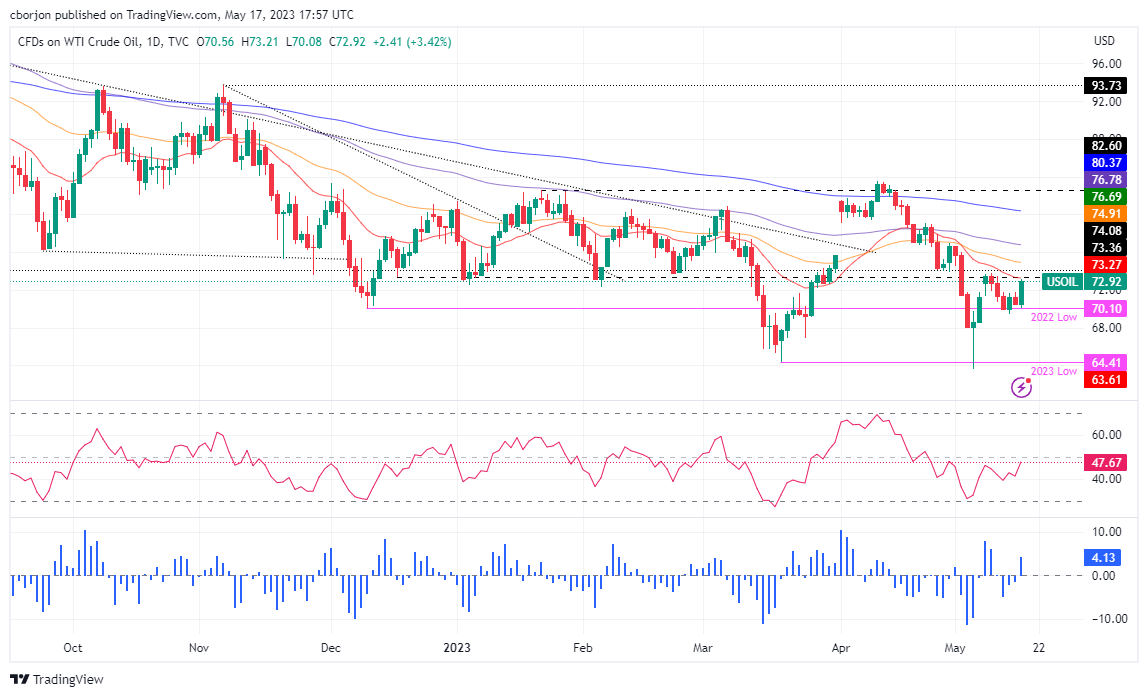
WTI has recovered some ground after dipping below the last year’s low of $70.10, reaching a two-week low of $69.44. However, WTI buyers moved in, lifting the price toward the 20-day Exponential Moving Average (EMA), which, once cleared, could pave the way to test the 50-day EMA at $74.91. Once cleared and up next would be the 100-day EMA at $76.78. Nevertheless, the Relative Strength Index (RSI) indicator continues at bearish territory, suggesting that sellers remain in charge. Therefore, WTI’s failure to crack the $73.00 PB area and a dip towards the $69.00 area is on the cards.

WTI US OIL

Overview
Today last price73.07
Today Daily Change2.53
Today Daily Change %3.59
Today daily open70.54
 
Trends
Daily SMA2073.64
Daily SMA5074.76
Daily SMA10076.41
Daily SMA20080.3
 
Levels
Previous Daily High71.76
Previous Daily Low70.45
Previous Weekly High73.81
Previous Weekly Low69.94
Previous Monthly High83.4
Previous Monthly Low73.88
Daily Fibonacci 38.2%70.95
Daily Fibonacci 61.8%71.26
Daily Pivot Point S170.07
Daily Pivot Point S269.61
Daily Pivot Point S368.76
Daily Pivot Point R171.38
Daily Pivot Point R272.23
Daily Pivot Point R372.69

Author

Christian Borjon Valencia

Christian Borjon began his career as a retail trader in 2010, mainly focused on technical analysis and strategies around it. He started as a swing trader, as he used to work in another industry unrelated to the financial markets.

More from Christian Borjon Valencia
Share:

Markets move fast. We move first.

Orange Juice Newsletter brings you expert driven insights - not headlines. Every day on your inbox.

By subscribing you agree to our Terms and conditions.

Editor's Picks

EUR/USD: Bulls pray for a dovish Fed

EUR/USD has finally taken a breather after a pretty energetic climb. The pair broke above 1.1680 in the second half of the week, reaching its highest levels in around two months before running into some selling pressure. Even so, it has gained almost two cents from the late-November dip just below 1.1500 the figure.

GBP/USD trims gains, recedes toward 1.3320

GBP/USD is struggling to keep its daily advance, coming under fresh pressure and retreating to the 1.3320 zone following a mild bullish attempt in the Greenback. Even though US consumer sentiment surprised to the upside, the US Dollar isn’t getting much love, as traders are far more interested in what the Fed will say next week.

Gold: Bullish momentum fades despite broad USD weakness

After rising more than 3.5% in the previous week, Gold has entered a consolidation phase and fluctuated at around $4,200. The Federal Reserve’s interest rate decision and revised Summary of Economic Projections, also known as the dot plot, could trigger the next directional move in XAU/USD. 

Week ahead: Rate cut or market shock? The Fed decides

Fed rate cut widely expected; dot plot and overall meeting rhetoric also matter. Risk appetite is supported by Fed rate cut expectations; cryptos show signs of life. RBA, BoC and SNB also meet; chances of surprises are relatively low. Dollar weakness could linger; both the aussie and the yen best positioned to gain further. Gold and oil eye Ukraine-Russia developments; a peace deal remains elusive.

The Silver disconnection is real

Silver just hit a new all-time high. Neither did gold, nor mining stocks. They all reversed on an intraday basis, but silver’s move to new highs makes it still bullish overall, while the almost complete reversals in gold and miners make the latter technically bearish.

Ripple faces persistent bear risks, shrugging off ETF inflows

Ripple is extending its decline for the second consecutive day, trading at $2.06 at the time of writing on Friday. Sentiment surrounding the cross-border remittance token continues to lag despite steady inflows into XRP spot ETFs.