• WTI advances on sentiment, Kurdistan oil exports halt.
  • Investors shrugged off the US banking system woes after First Citizens BankShares acquired Silicon Valley Bank.
  • WTI Price Analysis: Stuck in neutral to the downward trend but could rally to $80.00 once RSI turns bullish.

Western Texas Intermediate (WTI), the US crude oil benchmark, advances sharply on an upbeat sentiment. Another reason for oil’s jump was a halt to oil exports from Iraq Kurdistan and Putin’s nuclear threats. At the time of writing, WTI is trading at $71.13 per barrel.

A confidence vote in the banking system sparked a shift in market mood after First Citizens BankShares, Inc. takeover the Silicon Valley Bank (SVB). Reports emerging that US authorities are considering expanding emergency lending facilities gave another reason for hope, which was cheered by investors.

WTI’s reversed its course after a dragonfly doji emerged on its daily chart after Friday’s close. Hence, oil traders threaten to push prices to the 20-day EMA at $72.10.

In the middle east, an arbitrage case won by Baghdad halted 450K bpd exports from Kurdistan to Turkey due to Kurdistan’s need for Iraq’s consent to ship oil.

Russian President Vladimir Putin’s announcement to deploy tactical nuclear weapons in Belarus in an attempt to intimidate the West due to its support for Ukraine also contributed to the increase in oil prices. NATO described Putin’s comments as “dangerous and irresponsible:, and Ukraine called for a UN Security Council meeting.

At the same time, Russia’s Deputy Prime minister Alexander Novak commented that Moscow is close to achieving its 500K crude output, to about 9.5 million bpd.

WTI Technical analysis

WTI Daily chart

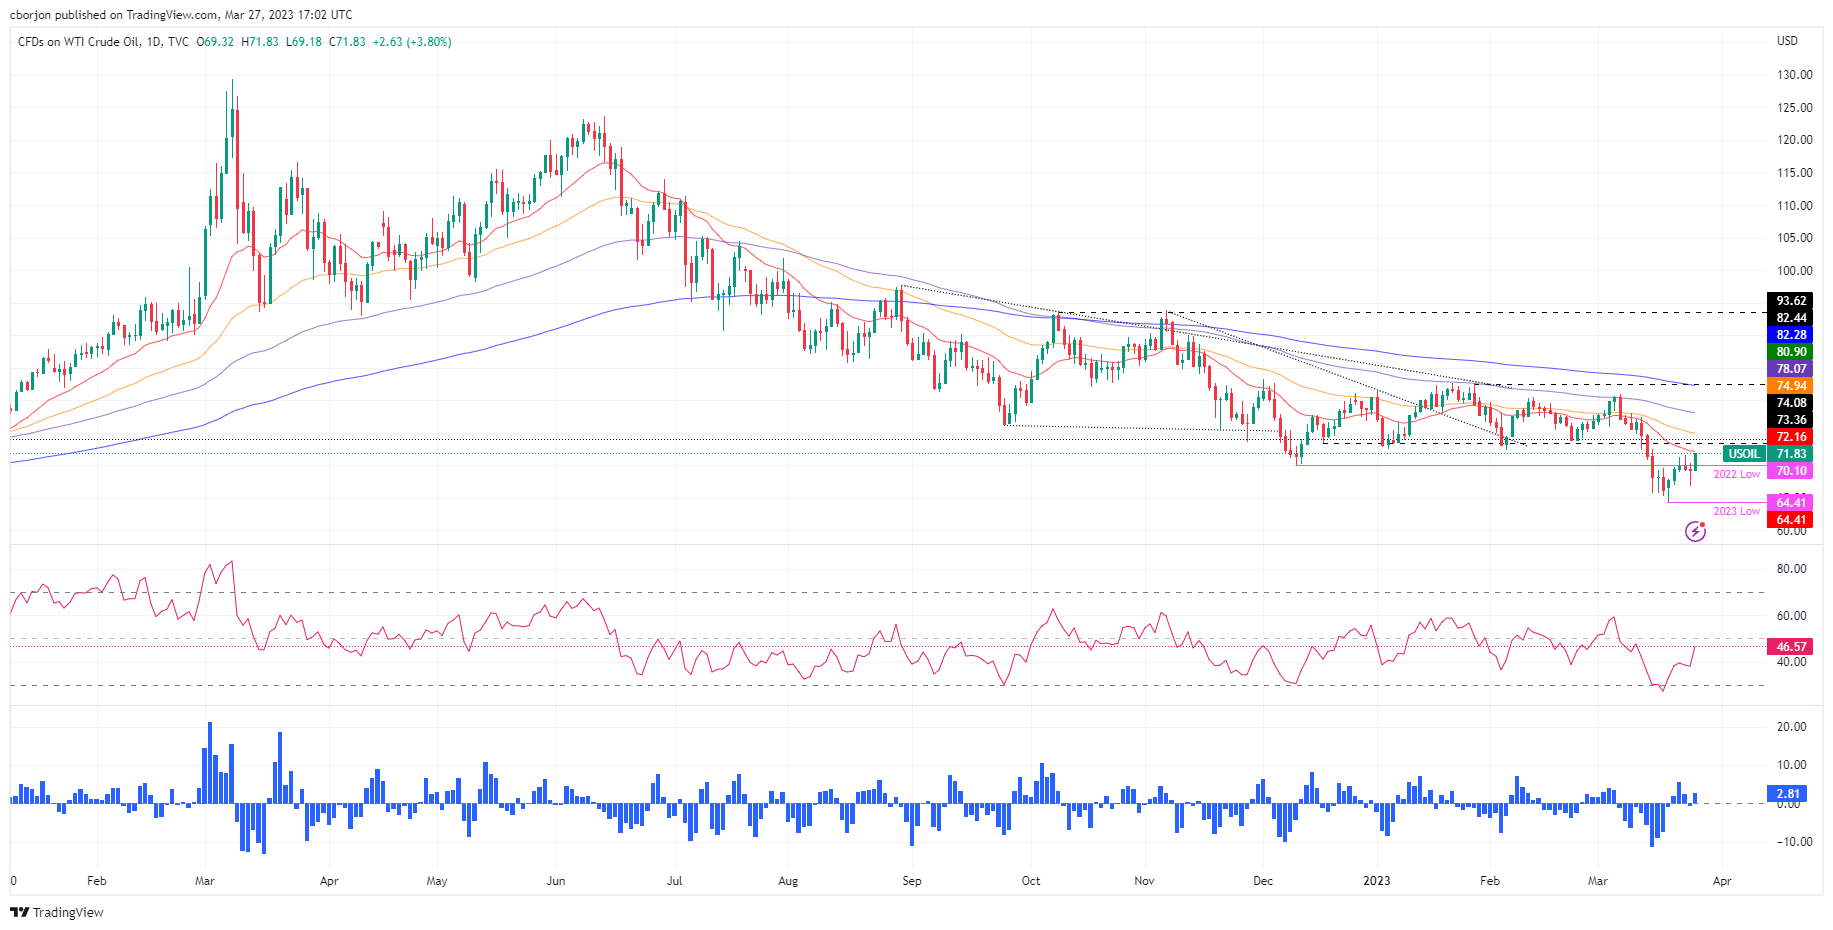
WTI is still neutral to downward biased, though approaching the 20-day EMA. Oscillators remain bearish, with the Relative Strength Index (RSI) below 50, but it’s aiming up. So, if RSI turns bullish, WTI’s could rally to $80.00. Hence, WTI’s first resistance would be the 20-day EMA at $72.10. A breach of the latter will expose the 50-day EMA at $74.93, followed by the 100-day EMA at $78.06, before testing $80.00.

WTI US OIL

Overview
Today last price 71.78
Today Daily Change 2.50
Today Daily Change % 3.61
Today daily open 69.28
 
Trends
Daily SMA20 73.56
Daily SMA50 76.43
Daily SMA100 77.64
Daily SMA200 84.45
 
Levels
Previous Daily High 70.42
Previous Daily Low 66.89
Previous Weekly High 71.69
Previous Weekly Low 64.39
Previous Monthly High 80.75
Previous Monthly Low 72.5
Daily Fibonacci 38.2% 68.23
Daily Fibonacci 61.8% 69.07
Daily Pivot Point S1 67.31
Daily Pivot Point S2 65.33
Daily Pivot Point S3 63.78
Daily Pivot Point R1 70.84
Daily Pivot Point R2 72.39
Daily Pivot Point R3 74.37


Share: Feed news

Information on these pages contains forward-looking statements that involve risks and uncertainties. Markets and instruments profiled on this page are for informational purposes only and should not in any way come across as a recommendation to buy or sell in these assets. You should do your own thorough research before making any investment decisions. FXStreet does not in any way guarantee that this information is free from mistakes, errors, or material misstatements. It also does not guarantee that this information is of a timely nature. Investing in Open Markets involves a great deal of risk, including the loss of all or a portion of your investment, as well as emotional distress. All risks, losses and costs associated with investing, including total loss of principal, are your responsibility. The views and opinions expressed in this article are those of the authors and do not necessarily reflect the official policy or position of FXStreet nor its advertisers. The author will not be held responsible for information that is found at the end of links posted on this page.

If not otherwise explicitly mentioned in the body of the article, at the time of writing, the author has no position in any stock mentioned in this article and no business relationship with any company mentioned. The author has not received compensation for writing this article, other than from FXStreet.

FXStreet and the author do not provide personalized recommendations. The author makes no representations as to the accuracy, completeness, or suitability of this information. FXStreet and the author will not be liable for any errors, omissions or any losses, injuries or damages arising from this information and its display or use. Errors and omissions excepted.

The author and FXStreet are not registered investment advisors and nothing in this article is intended to be investment advice.

Recommended content


Recommended content

Editors’ Picks

EUR/USD regains traction, recovers above 1.0700

EUR/USD regains traction, recovers above 1.0700

EUR/USD regained its traction and turned positive on the day above 1.0700 in the American session. The US Dollar struggles to preserve its strength after the data from the US showed that the economy grew at a softer pace than expected in Q1.

EUR/USD News

GBP/USD returns to 1.2500 area in volatile session

GBP/USD returns to 1.2500 area in volatile session

GBP/USD reversed its direction and recovered to 1.2500 after falling to the 1.2450 area earlier in the day. Although markets remain risk-averse, the US Dollar struggles to find demand following the disappointing GDP data.

GBP/USD News

Gold climbs above $2,340 following earlier drop

Gold climbs above $2,340 following earlier drop

Gold fell below $2,320 in the early American session as US yields shot higher after the data showed a significant increase in the US GDP price deflator in Q1. With safe-haven flows dominating the markets, however, XAU/USD reversed its direction and rose above $2,340.

Gold News

XRP extends its decline, crypto experts comment on Ripple stablecoin and benefits for XRP Ledger

XRP extends its decline, crypto experts comment on Ripple stablecoin and benefits for XRP Ledger

Ripple extends decline to $0.52 on Thursday, wipes out weekly gains. Crypto expert asks Ripple CTO how the stablecoin will benefit the XRP Ledger and native token XRP. 

Read more

After the US close, it’s the Tokyo CPI

After the US close, it’s the Tokyo CPI

After the US close, it’s the Tokyo CPI, a reliable indicator of the national number and then the BoJ policy announcement. Tokyo CPI ex food and energy in Japan was a rise to 2.90% in March from 2.50%.

Read more

Forex MAJORS

Cryptocurrencies

Signatures