|

WTI Price Analysis: Turns south after facing rejection once again above 50-SMA

  • WTI erases gains, returns to the red in the European session. 
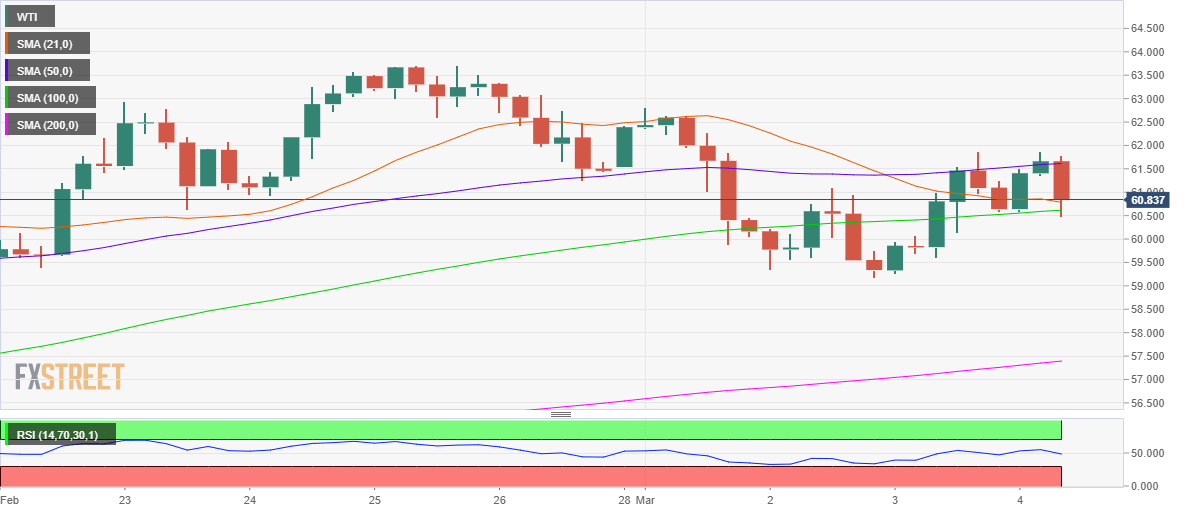
  • Bearish RSI suggests more downside in the offing.
  • OPEC+ outcome much-awaited alongside Powell’s speech.

WTI (futures on NYMEX) drops back below $61, shedding over $1 from daily highs of $61.87, as the bulls turn cautious ahead of the all-important outcome from the OPEC and its allies (OPEC+) meeting and Fed Chair Jerome Powell’s critical speech.

The black gold edged higher earlier this Thursday on reports that the alliance is likely to roll over the oil output cuts next month when compared to expectations of production hike, in light of improved global economic outlook.

Meanwhile, markets await Powell’s take on the recent yield surge, which could have a significant impact on the risk sentiment and the US dollar-sensitive oil.

From a technical perspective, the price of the WTI barrel has failed to find acceptance above the horizontal 50-simple moving average (SMA) on the four-hour chart, now at $61.61.

This has prompted the bears to regain control, knocking-off the prices sharply lower to test the fierce support around the $60.65 region. At that level, the bearish 21-SMA coincides with the upward-sloping 100-SMA.

The selling pressure could likely intensify if the black gold delivers a four-hour candlestick closing below the abovementioned cap. Subsequently, a test of the March low at $59.17 cannot be ruled out.

Alternatively, the WTI bulls need a sustained move above the 50-SMA to extending the upside, with the next resistance seen at the $62 round figure.

The Relative Strength Index (RSI) has pierced through the midline and entered the negative territory, suggesting that the downside seems more compelling in the session ahead.

WTI four-hour chart

WTI additional levels

WTI

Overview
Today last price60.55
Today Daily Change-0.55
Today Daily Change %-0.90
Today daily open61.1
 
Trends
Daily SMA2059.91
Daily SMA5054.81
Daily SMA10048.85
Daily SMA20044.51
 
Levels
Previous Daily High61.87
Previous Daily Low59.17
Previous Weekly High63.72
Previous Weekly Low58.81
Previous Monthly High63.72
Previous Monthly Low51.6
Daily Fibonacci 38.2%60.84
Daily Fibonacci 61.8%60.2
Daily Pivot Point S159.56
Daily Pivot Point S258.01
Daily Pivot Point S356.85
Daily Pivot Point R162.26
Daily Pivot Point R263.42
Daily Pivot Point R364.96

Author

Dhwani Mehta

Dhwani Mehta

FXStreet

Residing in Mumbai (India), Dhwani is a Senior Analyst and Manager of the Asian session at FXStreet. She has over 10 years of experience in analyzing and covering the global financial markets, with specialization in Forex and commodities markets.

More from Dhwani Mehta
Share:

Editor's Picks

AUD/USD struggles to recover as hawkish Fed bets escalate

The Australian Dollar is under pressure against the US Dollar as traders have raised bets supporting interest rate hikes by the Federal Reserve this year, with the AUD/USD pair posting a fresh almost eight-week low at around 0.7025. Hawkish Fed bets have accelerated following the release of the surprisingly strong United States Nonfarm Payroll (NFP) data for May.

USD/JPY holds higher ground toward 160.50 despite 'Yentervention' fears

USD/JPY holds higher ground toward 160.50 in Monday's Asian trading, despite intervention fears. Japan’s revised GDP print, which confirmed that the economy lost momentum in the first quarter, weighs on the Japanese Yen. Meanwhile, Friday's upbeat US NFP report and fresh Israel-Iran attacks favor the US Dollar bulls, underpinning the currency pair.

Gold sticks to the positive bias, still below  $4,350

Gold manages to reclaim the $4,300 mark per troy ounce and above on Monday. The yellow metal’s small uptick comes on the back of modest losses in the US Dollar, while traders continue to follow geopolitical events in the Middle East and the likelihood of a tighter-for-longer Fed.

Solana: ETF outflows and bearish sentiment reinforce downside risks

Solana (SOL) remains under pressure, trading below $66 on Monday after losing nearly 20% in the previous week. Institutional demand weakened with spot Exchange Traded Funds recording a net outflow of over $6.5 million last week, snapping a four-week streak of inflows.

$1.75 trillion: Is SpaceX the most popular IPO in history, or the most engineered?

On June 12, the largest initial public offering (IPO) in history is set to hit the tape, and almost nobody is asking whether the price is right, because almost everybody already wants in.

The US economy defies the rules: 100 days into the Oil shock and the recession signal is still missing

More than three months after the start of the Iran war and the resulting disruption to global energy markets, the US economy continues to display remarkable resilience. The conflict has triggered a sharp rise in Oil prices, reignited inflationary pressures and fueled widespread concerns about a potential economic slowdown.