|

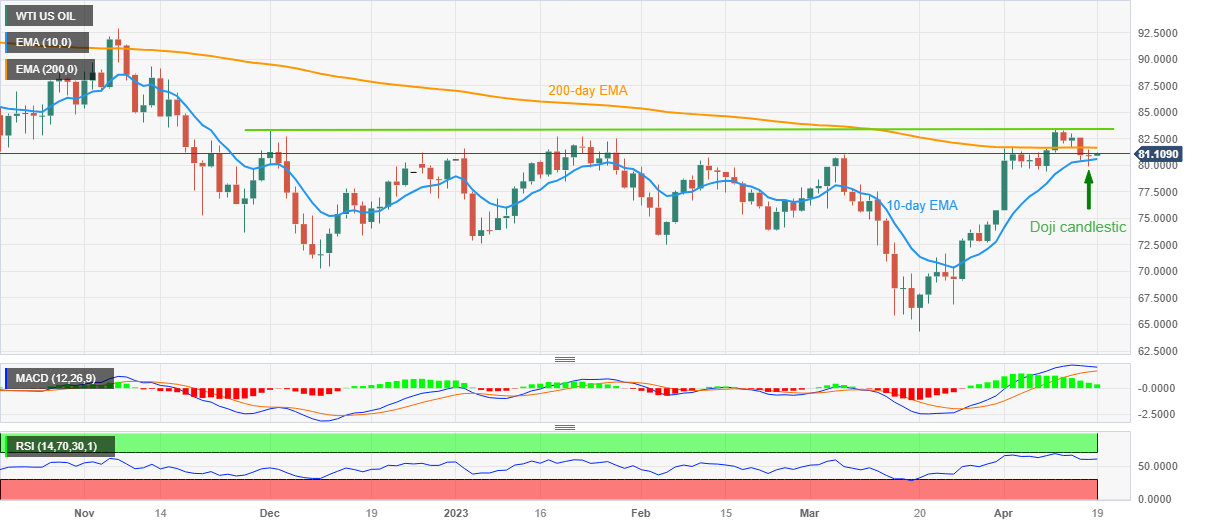
WTI Price Analysis: Tuesday’s Doji teases Oil buyers around $81.00

  • WTI crude oil remains sidelined after posting a price-reversal suggesting candlestick the previous day.
  • U-turn from 10-day EMA, firmer RSI (14) also keeps WTI buyers hopeful.
  • 200-day EMA, easing bullish bias of MACD prods upside expectations.
  • Double tops around $83.30-40 appear a tough nut to crack for Oil bulls to retake control.

WTI crude oil rises to $81.10 early Wednesday, after a sluggish performance on Tuesday.

In doing so, the back gold justifies the previous day’s Doji candlestick which generally suggests a reversal of the previous trend. Herein, it suggests the reversal of the previous week’s pullback from multi-day-old horizontal resistance.

Not only the Doji candlestick but a U-turn from the 10-day Exponential Moving Average (EMA), around $80.60 by the press time, also keeps the Oil buyers hopeful, especially amid a firmer but not overbought RSI (14) line.

However, the 200-day EMA challenges the WTI bulls around $81.70, together with the receding bullish bias of the MACD signals.

Following that, a horizontal area comprising tops marked since December 2022, around $83.30-40, becomes crucial to watch for the Oil buyers as a break that could push back the bearish bias about the commodity.

Alternatively, a downside break of the 10-day EMA level of around $80.60 needs validation from the $80.00 psychological magnet, as well as the previous weekly low of around $79.35, to convince the Oil bears.

Even so, multiple stops around $77.50 may challenge the WTI crude oil bears afterward.

WTI crude oil: Daily chart
Trend: Further recovery expected

Additional important levels

Overview
Today last price80.92
Today Daily Change0.03
Today Daily Change %0.04%
Today daily open80.89
 
Trends
Daily SMA2077.07
Daily SMA5076.41
Daily SMA10077.01
Daily SMA20082.39
 
Levels
Previous Daily High81.51
Previous Daily Low79.91
Previous Weekly High83.4
Previous Weekly Low79.4
Previous Monthly High80.99
Previous Monthly Low64.39
Daily Fibonacci 38.2%80.52
Daily Fibonacci 61.8%80.9
Daily Pivot Point S180.03
Daily Pivot Point S279.17
Daily Pivot Point S378.43
Daily Pivot Point R181.63
Daily Pivot Point R282.37
Daily Pivot Point R383.23

Author

Anil Panchal

Anil Panchal

FXStreet

Anil Panchal has nearly 15 years of experience in tracking financial markets. With a keen interest in macroeconomics, Anil aptly tracks global news/updates and stays well-informed about the global financial moves and their implications.


More from Anil Panchal
Share:

Editor's Picks

GBP/USD clings to gains near 1.3400

GBP/USD retreats after reaching a three-week high above 1.3430, challenging the 1.3400 yardstick on Thursday. Although easing political uncertainty in the UK helps the quid limit its downside, escalating tensions in the Middle East support the Greenback, keeping Cable under scrutiny.

EUR/USD faces resistance around 1.1450

EUR/USD keeps the bid bias although it seems to have met a tough hurdle around 1.1450 on Thursday. The pair’s advance follows the bearish tone in the US Dollar despite escalating tensions in the Middle East and a broad-based cautious stance from market participants.

Gold flirts with two-day highs, approaches $4,130

Gold stages a modest rebound on Thursday, setting aside a three-day losing streak and managing to surpass the $4,100 mark per troy ounce. However, steady geopolitical tensions have revived concerns over persistently high global inflation, reinforcing expectations of higher rates across the board and somewhat curtailing the yellow metal’s upside potential.

Bitcoin stalls as mixed ETF flows, renewed US-Iran tensions cap upside

Bitcoin trades at $63,000 on Thursday, recovering slightly after facing rejection near $64,000. Renewed geopolitical uncertainty has dampened risk appetite, limiting BTC upside potential.

Japan may be changing its Yen strategy, but markets don’t look scared
Japan may be changing its intervention playbook, but that might not be enough to rescue the battered Yen. With USD/JPY hovering at four-decade highs, the currency’s weakness is being driven less by speculative pressure and more by a powerful structural force: the wide US-Japan rate gap.
Bye, forward guidance: How to trade when central banks choose silence

Central banks have spent years telling markets what might come next. Now, traders face the possibility that they say a lot less. From the Federal Reserve to the European Central Bank and the Bank of England, policymakers are pushing back against forward guidance.















