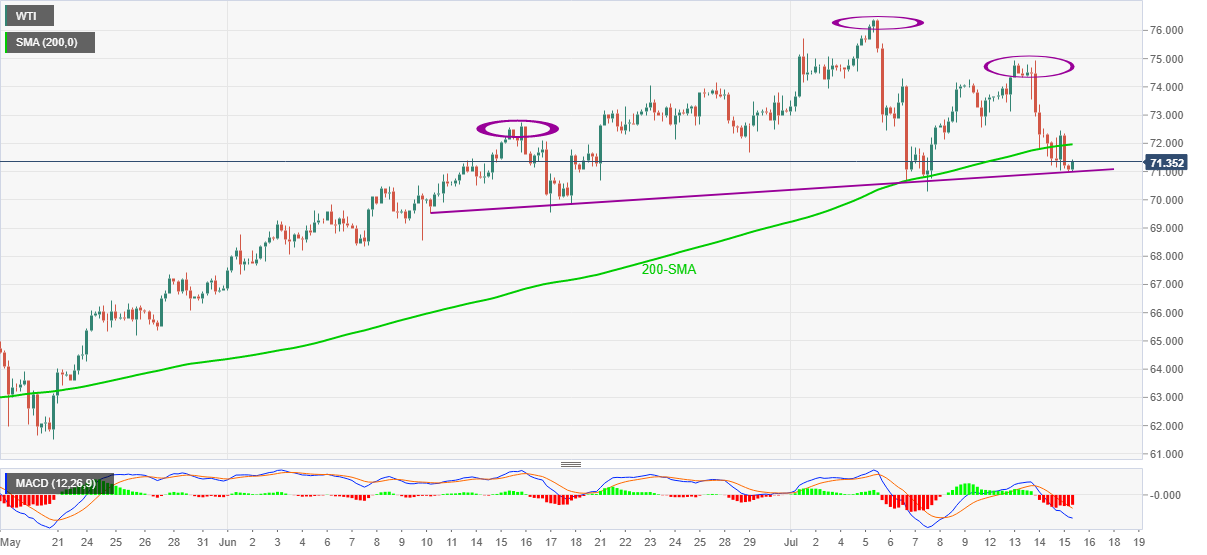
WTI Price Analysis: Teases head-and-shoulders confirmation on 4H, focus on $71.00


  • WTI bounces off intraday low, from the neckline of bearish formation.
  • MACD condition, sustained break of 200-SMA favor sellers.

WTI consolidates weekly losses while picking up bids around $71.70, up 0.30% intraday, during early Friday.

In doing so, the black gold takes a U-turn from the support line of a bearish chart pattern, head-and-shoulders, on the four-hour (4H) chart. Even so, the 200-SMA breakdown and downbeat MACD signal further downside of the energy prices.

Hence, bears should wait for a clear downside break of $71.00 to aim for late May’s low around $65.00.

During the fall, the $70.00 threshold and the early June’s wing lows near $68.30–35 could test the commodity’s downside.

Meanwhile, a clear break of the 200-SMA level of $72.00 will highlight the $72.50 and $74.30 resistances.

However, WTI bulls may remain cautious until the quote stays below the $75.00 hurdle.

Overall, oil buyers seem to have tired and a confirmation of the bearish chart pattern can trigger the much-awaited pullback in prices.

WTI: Four-hour chart

Trend: Further weakness expected

Additional important levels

Overview
Today last price 71.33
Today Daily Change 0.14
Today Daily Change % 0.20%
Today daily open 71.19
 
Trends
Daily SMA20 73.22
Daily SMA50 69.65
Daily SMA100 65.95
Daily SMA200 56.89
 
Levels
Previous Daily High 72.49
Previous Daily Low 71.02
Previous Weekly High 76.4
Previous Weekly Low 70.28
Previous Monthly High 74.17
Previous Monthly Low 66.78
Daily Fibonacci 38.2% 71.58
Daily Fibonacci 61.8% 71.93
Daily Pivot Point S1 70.64
Daily Pivot Point S2 70.1
Daily Pivot Point S3 69.18
Daily Pivot Point R1 72.11
Daily Pivot Point R2 73.03
Daily Pivot Point R3 73.57


Share: Feed news

Information on these pages contains forward-looking statements that involve risks and uncertainties. Markets and instruments profiled on this page are for informational purposes only and should not in any way come across as a recommendation to buy or sell in these assets. You should do your own thorough research before making any investment decisions. FXStreet does not in any way guarantee that this information is free from mistakes, errors, or material misstatements. It also does not guarantee that this information is of a timely nature. Investing in Open Markets involves a great deal of risk, including the loss of all or a portion of your investment, as well as emotional distress. All risks, losses and costs associated with investing, including total loss of principal, are your responsibility. The views and opinions expressed in this article are those of the authors and do not necessarily reflect the official policy or position of FXStreet nor its advertisers. The author will not be held responsible for information that is found at the end of links posted on this page.

If not otherwise explicitly mentioned in the body of the article, at the time of writing, the author has no position in any stock mentioned in this article and no business relationship with any company mentioned. The author has not received compensation for writing this article, other than from FXStreet.

FXStreet and the author do not provide personalized recommendations. The author makes no representations as to the accuracy, completeness, or suitability of this information. FXStreet and the author will not be liable for any errors, omissions or any losses, injuries or damages arising from this information and its display or use. Errors and omissions excepted.

The author and FXStreet are not registered investment advisors and nothing in this article is intended to be investment advice.

Recommended content


Recommended content

Editors’ Picks

EUR/USD clings to gains near 1.0700, awaits key US data

EUR/USD clings to gains near 1.0700, awaits key US data

EUR/USD clings to gains near the 1.0700 level in early Europe on Thursday. Renewed US Dollar weakness offsets the risk-off market environment, supporting the pair ahead of the key US GDP and PCE inflation data. 

EUR/USD News

USD/JPY keeps pushing higher, eyes 156.00 ahead of US GDP data

USD/JPY keeps pushing higher, eyes 156.00 ahead of US GDP data

USD/JPY keeps breaking into its highest chart territory since June of 1990 early Thursday, recapturing 155.50 for the first time in 34 years as the Japanese Yen remains vulnerable, despite looming intervention risks. The focus shifts to Thursday's US GDP report and the BoJ decision on Friday. 

USD/JPY News

Gold price lacks firm intraday direction, holds steady above $2,300 ahead of US data

Gold price lacks firm intraday direction, holds steady above $2,300 ahead of US data

Gold price remains confined in a narrow band for the second straight day on Thursday. Reduced Fed rate cut bets and a positive risk tone cap the upside for the commodity. Traders now await key US macro data before positioning for the near-term trajectory.

Gold News

Injective price weakness persists despite over 5.9 million INJ tokens burned

Injective price weakness persists despite over 5.9 million INJ tokens burned

Injective price is trading with a bearish bias, stuck in the lower section of the market range. The bearish outlook abounds despite the network's deflationary efforts to pump the price. Coupled with broader market gloom, INJ token’s doomed days may not be over yet.

Read more

Meta takes a guidance slide amidst the battle between yields and earnings

Meta takes a guidance slide amidst the battle between yields and earnings

Meta's disappointing outlook cast doubt on whether the market's enthusiasm for artificial intelligence. Investors now brace for significant macroeconomic challenges ahead, particularly with the release of first-quarter gross domestic product (GDP) data on Thursday.

Read more

Forex MAJORS

Cryptocurrencies

Signatures