|

WTI Price Analysis: Reverses from three-week high towards previous resistance surrounding $78.50

  • WTI takes offers to refresh intraday low, snaps four-day uptrend.
  • RSI’s retreat from overbought territory, sluggish MACD favor latest declines.
  • Five-week-old previous resistance, 200-SMA restrict short-term downside moves.
  • Oil bulls have a bumpy road to travel in case of fresh recovery.

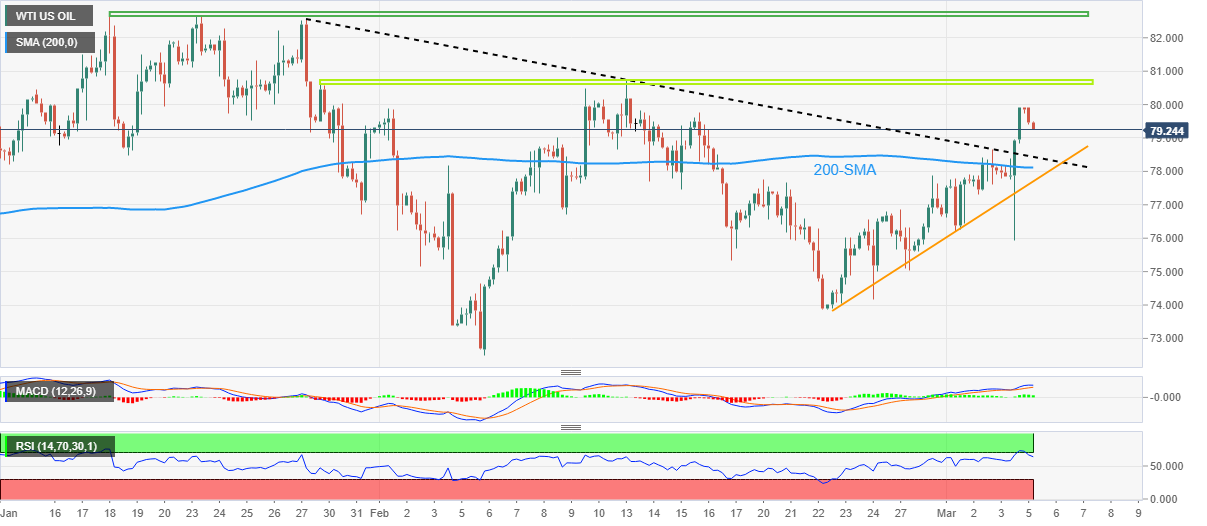
WTI crude oil returns to the bear’s radar, after a four-day winning streak, as the energy benchmark takes a U-turn from a three-week high to print 0.70% intraday losses around $79.30 during early Monday.

In doing so, the black gold traces the RSI (14) as it reverses from the overbought territory. However, the sluggish MACD signals hint at the lack of momentum and hence challenge the Oil bears.

Additionally testing the commodity’s latest weakness could be a downward-sloping support line from January 27, previous resistance around $78.45.

Even if the WTI bears manage to conquer resistance-turned-support of near $78.45, the 200-SMA and an ascending support line from late February, respectively near $78.10 and $77.70, could restrict the quote’s further downside before convincing the sellers.

Meanwhile, recovery moves may initially aim for the $80.00 psychological magnet before targeting the five-week-long horizontal resistance area surrounding $80.65-70.

Following that, a horizontal resistance zone comprising tops marked since January 18, close to $82.65-70, could challenge the WTI bulls before giving them control.

Overall, WTI crude oil is likely to witness further downside but the bears need to remain cautious unless witnessing a clear break of the $77.70.

WTI: Four-hour chart

Trend: Limited downside expected

Additional important levels

Overview
Today last price79.26
Today Daily Change-0.59
Today Daily Change %-0.74%
Today daily open79.85
 
Trends
Daily SMA2077.46
Daily SMA5078.02
Daily SMA10079.78
Daily SMA20087.76
 
Levels
Previous Daily High79.93
Previous Daily Low75.93
Previous Weekly High79.93
Previous Weekly Low75.05
Previous Monthly High80.75
Previous Monthly Low72.5
Daily Fibonacci 38.2%78.4
Daily Fibonacci 61.8%77.45
Daily Pivot Point S177.21
Daily Pivot Point S274.57
Daily Pivot Point S373.21
Daily Pivot Point R181.21
Daily Pivot Point R282.57
Daily Pivot Point R385.21

Author

Anil Panchal

Anil Panchal

FXStreet

Anil Panchal has nearly 15 years of experience in tracking financial markets. With a keen interest in macroeconomics, Anil aptly tracks global news/updates and stays well-informed about the global financial moves and their implications.

More from Anil Panchal
Share:

Markets move fast. We move first.

Orange Juice Newsletter brings you expert driven insights - not headlines. Every day on your inbox.

By subscribing you agree to our Terms and conditions.

Editor's Picks

EUR/USD clings to small gains near 1.1750

Following a short-lasting correction in the early European session, EUR/USD regains its traction and clings to moderate gains at around 1.1750 on Monday. Nevertheless, the pair's volatility remains low, with investors awaiting this weeks key data releases from the US and the ECB policy announcements.

GBP/USD edges higher toward 1.3400 ahead of US data and BoE

GBP/USD reverses its direction and advances toward 1.3400 following a drop to the 1.3350 area earlier in the day. The US Dollar struggles to gather recovery momentum as markets await Tuesday's Nonfarm Payrolls data, while the Pound Sterling holds steady ahead of the BoE policy announcements later in the week.

Gold stuck around $4,300 as markets turn cautious

Gold loses its bullish momentum and retreats below $4,350 after testing this level earlier on Monday. XAU/USD, however, stays in positive territory as the US Dollar remains on the back foot on growing expectations for a dovish Fed policy outlook next year.

Solana consolidates as spot ETF inflows near $1 billion signal institutional dip-buying

Solana price hovers above $131 at the time of writing on Monday, nearing the upper boundary of a falling wedge pattern, awaiting a decisive breakout. On the institutional side, demand for spot Solana Exchange-Traded Funds remained firm, pushing total assets under management to nearly $1 billion since launch. 

Big week ends with big doubts

The S&P 500 continued to push higher yesterday as the US 2-year yield wavered around the 3.50% mark following a Federal Reserve (Fed) rate cut earlier this week that was ultimately perceived as not that hawkish after all. The cut is especially boosting the non-tech pockets of the market.

Solana Price Forecast: SOL consolidates as spot ETF inflows near $1 billion signal institutional dip-buying

Solana (SOL) price hovers above $131 at the time of writing on Monday, nearing the upper boundary of a falling wedge pattern, awaiting a decisive breakout.