WTI Price Analysis: Refreshes five-month low below $34.00 inside weekly falling channel
- WTI prints four-day losing streak, drops the fresh low May 29.
- Oversold RSI can trigger pull back from the immediate support line.
- Bulls need an upside break above 200-bar SMA for fresh entries.

WTI drops to $33.85, currently around $34.11, during Monday’s Asian session. In doing so, the energy benchmark slips below the multi-day bottom flashed last week.
Even if a one-week-old falling channel keeps the oil bears hopeful, oversold RSI conditions may consolidate losses from the support line of the bearish chart pattern, at $33.37 now.
Should the sellers refrain from bouncing off $33.37, the late-May low near $31.30 could return to the charts.
Meanwhile, the $35.00 round-figure and resistance line of the stated channel, around $35.95, can probe the quote’s short-term pullbacks.
However, any recovery moves below the 200-bar SMA level of $39.82 are less likely to convince energy the bulls.
WTI four-hour chart
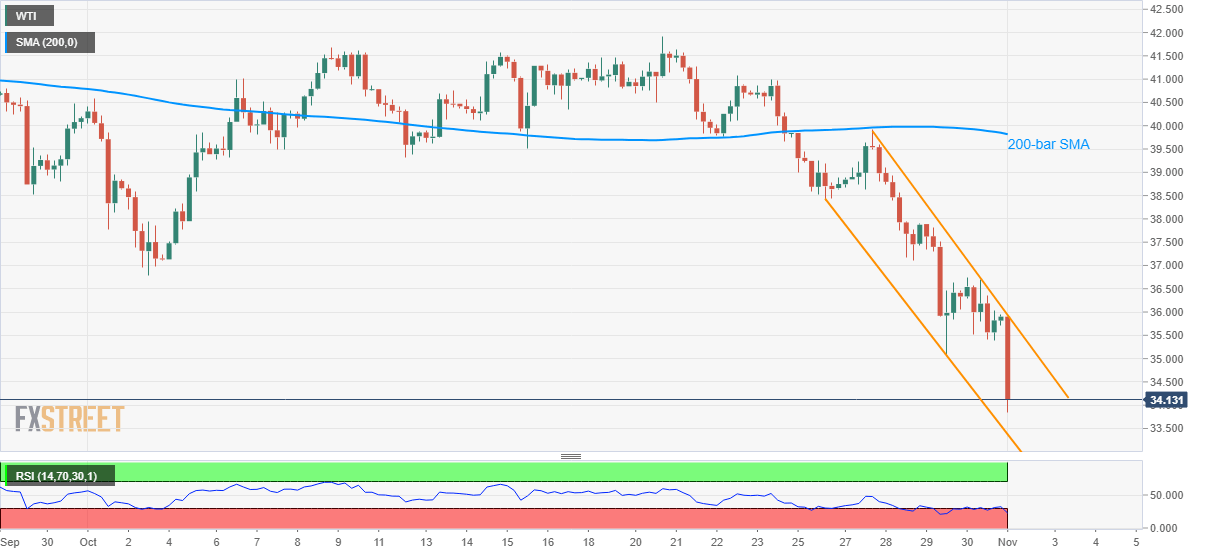
Trend: Bearish
Author

Anil Panchal
FXStreet
Anil Panchal has nearly 15 years of experience in tracking financial markets. With a keen interest in macroeconomics, Anil aptly tracks global news/updates and stays well-informed about the global financial moves and their implications.


