WTI Price Analysis: Recovery moves confront 61.8% Fibonacci retracement
- WTI pulls back from a two-week-old support line.
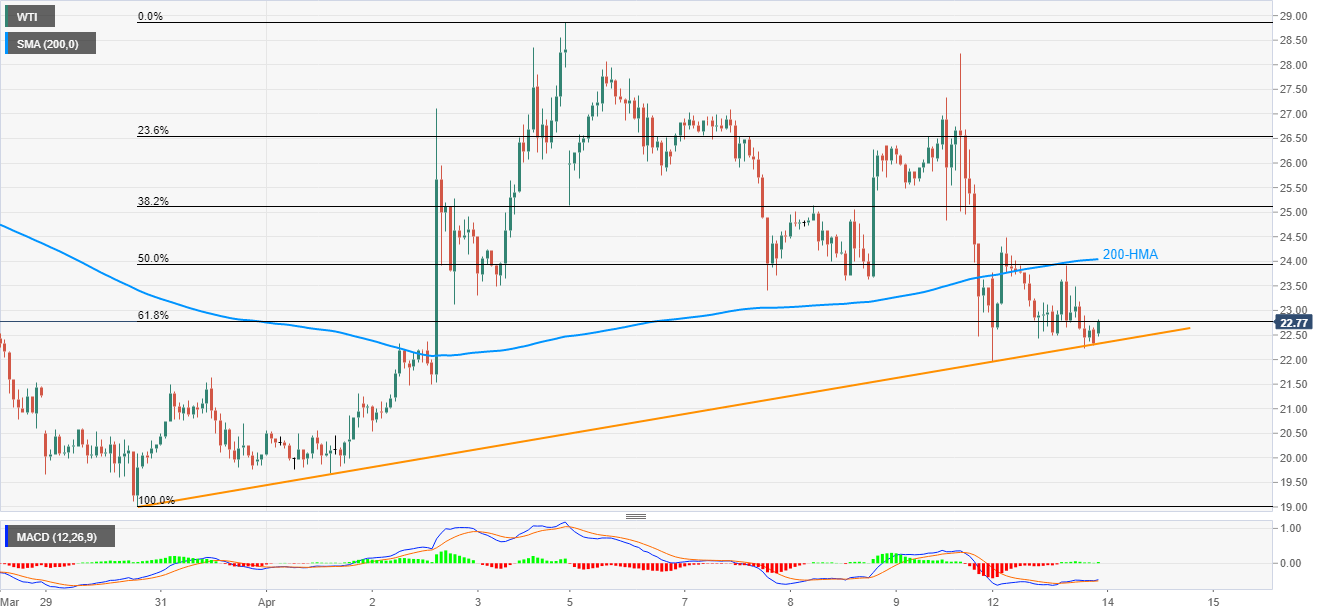
- A confluence of 200-HMA, 50% Fibonacci retracement adds to resistance.
- March-end top on the sellers’ radar during further downside.

While extending its recovery moves from the short-term rising trend line, WTI takes the bids to $22.75 amid the early Asian session on Tuesday. In doing so, the black gold confronts 61.8% Fibonacci retracement of its upside from March 30 to April 03.
Considering the strength of the support line, as well as MACD conditions, the energy benchmark is expected to successfully cross $22.80 immediate resistance.
Even so, a confluence of 200-HMA, 50% Fibonacci retracement around $23.95/24.05 becomes the tough nut to crack for buyers.
On the contrary, a downside break below $22.30 support line will trigger fresh declines towards March 31 top near $21.60.
During additional south-run by the oil prices below $21.60, $20.00 and the previous month low around $19.00 becomes the key to watch.
WTI hourly chart
Trend: Pullback expected
Author

Anil Panchal
FXStreet
Anil Panchal has nearly 15 years of experience in tracking financial markets. With a keen interest in macroeconomics, Anil aptly tracks global news/updates and stays well-informed about the global financial moves and their implications.


