|

WTI Price Analysis: Oil trapped in a pennant pattern on 1H

  • WTI's hourly chart shows a pennant pattern or contracting triangle. 
  • A breakdown would signal bearish continuation and expose June lows. 

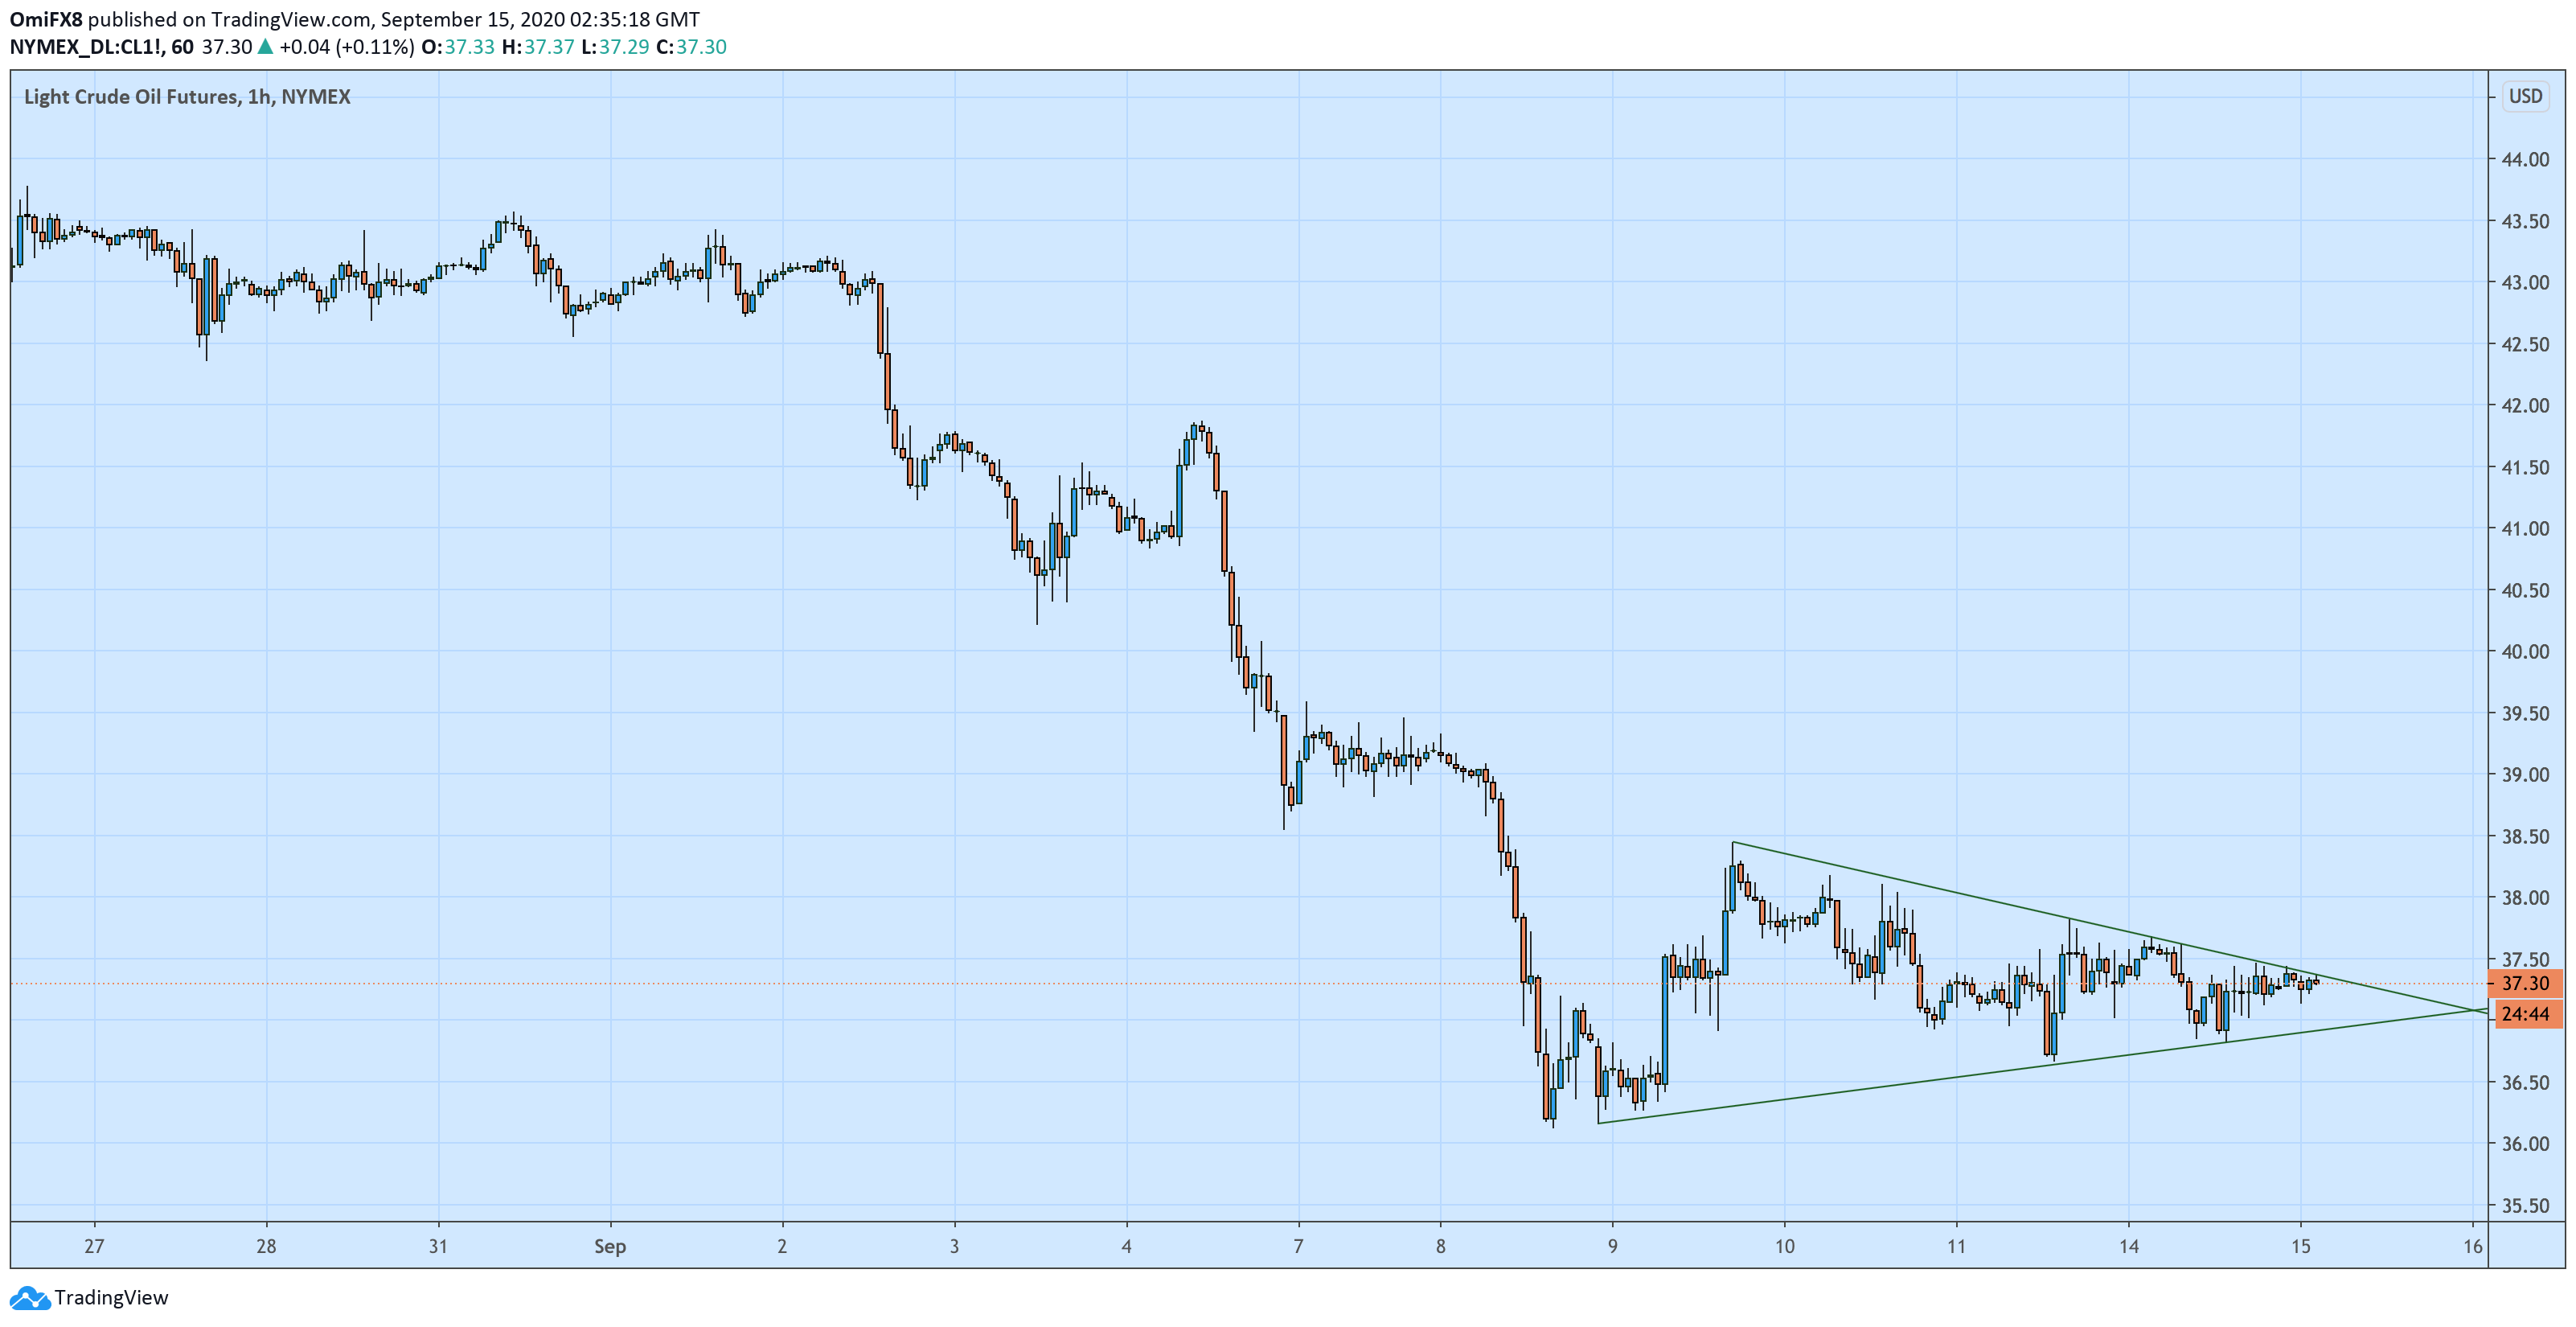
West Texas Intermediate (WTI) crude has carved out a narrowing price range or pennant pattern on the hourly chart. 

The upper end of the pennant pattern is currently seen at $37.37. A breakout above that level would mean the sell-off from the August high of $43.78 has ended, and the bulls have regained control. 

Alternatively, a move below the lower end of the pennant, currently at $36.92, would imply a continuation of the sell-off from August's high and expose deeper support levels lined up at $34.36 (June 15 low). 

At press time, a barrel of WTI is changing hands near $37.30.

Hourly chart

Trend: Bearish below $36.92 

Technical levels

WTI

Overview
Today last price37.30
Today Daily Change0.03
Today Daily Change %0.08
Today daily open37.51
 
Trends
Daily SMA2041.13
Daily SMA5041.27
Daily SMA10037.37
Daily SMA20041.3
 
Levels
Previous Daily High37.93
Previous Daily Low37.08
Previous Weekly High39.78
Previous Weekly Low36.43
Previous Monthly High43.86
Previous Monthly Low39.75
Daily Fibonacci 38.2%37.4
Daily Fibonacci 61.8%37.6
Daily Pivot Point S137.08
Daily Pivot Point S236.66
Daily Pivot Point S336.24
Daily Pivot Point R137.93
Daily Pivot Point R238.35
Daily Pivot Point R338.78

Author

Omkar Godbole

Omkar Godbole

FXStreet Contributor

Omkar Godbole, editor and analyst, joined FXStreet after four years as a research analyst at several Indian brokerage companies.

More from Omkar Godbole
Share:

Markets move fast. We move first.

Orange Juice Newsletter brings you expert driven insights - not headlines. Every day on your inbox.

By subscribing you agree to our Terms and conditions.

Editor's Picks

EUR/USD could test 1.1750 amid strengthening bullish bias

EUR/USD remains flat after two days of small losses, trading around 1.1740 during the Asian hours on Thursday. On the daily chart, technical analysis indicates a strengthening of a bullish bias, as the pair continues to trade within an ascending channel pattern.

GBP/USD consolidates above mid-1.3300s as traders await BoE and US CPI report

The GBP/USD pair struggles to capitalize on the overnight bounce from the 1.3310 area, or a one-week low, and oscillates in a narrow band during the Asian session on Thursday. Spot prices currently trade around the 1.3370 region, down less than 0.10% for the day, as traders opt to wait on the sidelines ahead of the key central bank event risk and US consumer inflation data.

Gold awaits weekly trading range breakout ahead of US CPI report

Gold struggles to capitalize on the previous day's move higher back closer to the $4,350 level and trades with a mild negative bias during the Asian session on Thursday. The downtick could be attributed to some profit-taking amid a US Dollar uptick, though it is likely to remain cushioned on the back of a supportive fundamental backdrop. 

Dogecoin breaks key support amid declining investor confidence

Dogecoin trades in the red on Thursday, following a 4% decline on the previous day. The DOGE supply in profit declines as large wallet investors trim their portfolios. Derivatives data shows a surge in bearish positions amid declining retail interest.

Monetary policy: Three central banks, three decisions, the same caution

While the Fed eased its monetary policy on 10 December for the third consecutive FOMC meeting, without making any guarantees about future action, the BoE, the ECB and the BoJ are holding their respective meetings this week. 

Dogecoin Price Forecast: DOGE breaks key support amid declining investor confidence

Dogecoin (DOGE) trades in the red on Thursday, following a 4% decline on the previous day. The DOGE supply in profit declines as large wallet investors trim their portfolios. Derivatives data shows a surge in bearish positions amid declining retail interest.