|

WTI Price Analysis: Oil hits 13-month high, challenges 13-year bearish trendline

  • The US oil prices rise to the highest level in 12 months. 
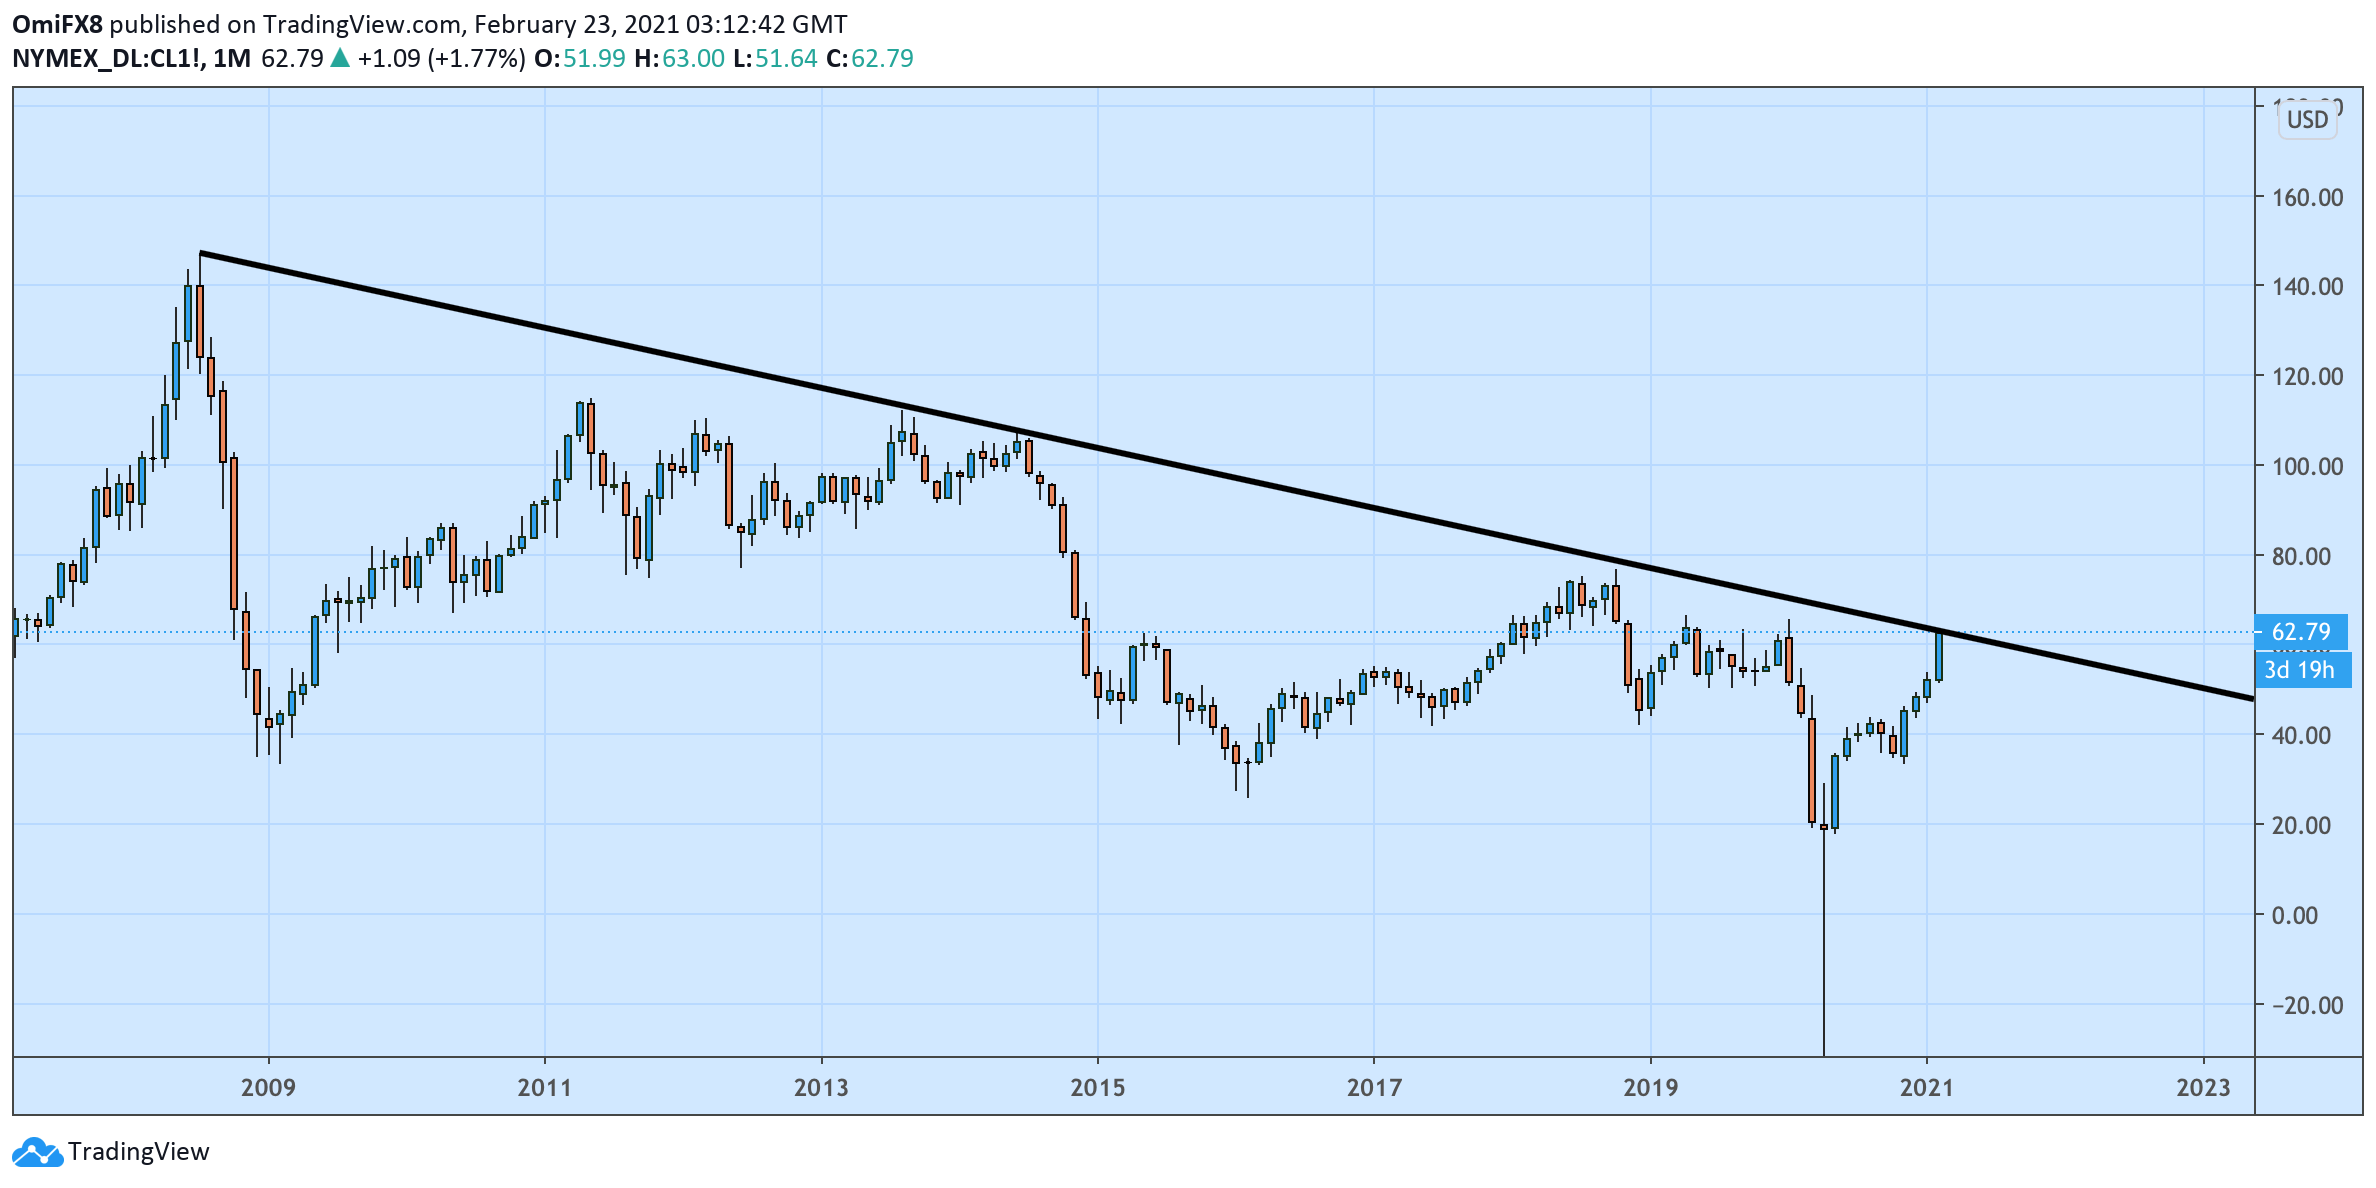
  • The monthly chart shows prices are flirting with a major bearish trendline.

West Texas Intermediate (WTI) crude is trading at $62.77 per barrel at press time. 

That's the highest level since January 2020, and the resistance of the trendline falling from July 2008 and July 2014 highs. 

Expectations of a swift vaccine-led global economic recovery and the recent cold blast in Texas have powered the North American oil benchmark to multi-year highs. 

A break above that trendline hurdle would mark a reversal higher from decade-long bearish price action and shift focus to $66.60 (April 2019 high). 

Analysts at Goldman Sachs have reportedly raised their 2021 WTI price forecast to $66 per barrel from $58 per barrel. The following year, the oil benchmark is seen rising to $67 per barrel versus the previous $62 per barrel projection. 

Monthly chart

Trend: Bullish

Technical levels

WTI

Overview
Today last price62.77
Today Daily Change1.26
Today Daily Change %2.05
Today daily open61.54
 
Trends
Daily SMA2057.04
Daily SMA5052.93
Daily SMA10047.38
Daily SMA20043.53
 
Levels
Previous Daily High61.77
Previous Daily Low58.81
Previous Weekly High62.25
Previous Weekly Low58.58
Previous Monthly High53.94
Previous Monthly Low47.26
Daily Fibonacci 38.2%60.64
Daily Fibonacci 61.8%59.94
Daily Pivot Point S159.64
Daily Pivot Point S257.75
Daily Pivot Point S356.68
Daily Pivot Point R162.6
Daily Pivot Point R263.67
Daily Pivot Point R365.57


Author

Omkar Godbole

Omkar Godbole

FXStreet Contributor

Omkar Godbole, editor and analyst, joined FXStreet after four years as a research analyst at several Indian brokerage companies.

More from Omkar Godbole
Share:

Editor's Picks

EUR/USD deflates to fresh lows, targets 1.1600

The selling pressure on EUR/USD now gathers extra pace, prompting the pair to hit fresh multi-week lows in the 1.1625-1.1620 band on Friday. The continuation of the downward bias comes in response to further gains in the US Dollar as market participants continue to assess the mixed release of US Nonfarm Payrolls in December.

GBP/USD breaks below 1.3400, challenges the 200-day SMA

GBP/USD remains under heavy fire and retreats for the fourth consecutive day on Friday. Indeed, Cable suffers the strong performance of the Greenback, intensified post-mixed NFP, and trades at shouting distance from its critical 200-day SMA near 1.3380.

Gold flirts with yearly tops around $4,500

Gold keeps its positive bias on Friday, adding to Thursday’s advance and challenging yearly highs in the $4,500 region per troy ounce. The risk-off sentiment favours the yellow metal despite the firmer tone in the Greenback and rising US Treasury yields.

Crypto Today: Bitcoin, Ethereum, XRP risk further decline as market fear persists amid slowing demand

Bitcoin holds $90,000 but stays below the 50-day EMA as institutional demand wanes. Ethereum steadies above $3,000 but remains structurally weak due to ETF outflows. XRP ETFs resume inflows, but the price struggles to gain ground above key support.

Week ahead – US CPI might challenge the geopolitics-boosted Dollar

Geopolitics may try to steal the limelight from US data. A possible US Supreme Court ruling on tariffs could dictate market movements. A crammed data calendar next week, US CPI comes on Tuesday; Fedspeak to intensify.

XRP trades under pressure amid weak retail demand

XRP presses down on the 50-day EMA support as risk-averse sentiment spreads despite a positive start to 2026. XRP faces declining retail demand, as reflected in futures Open Interest, which has fallen to $4.15 billion.