|

WTI Price Analysis: Oil falls back below 200-day SMA

  • WTI flips the 200-day SMA into support after rejection at $41.28. 
  • A close below Thursday's low may invite more substantial chart-driven selling. 

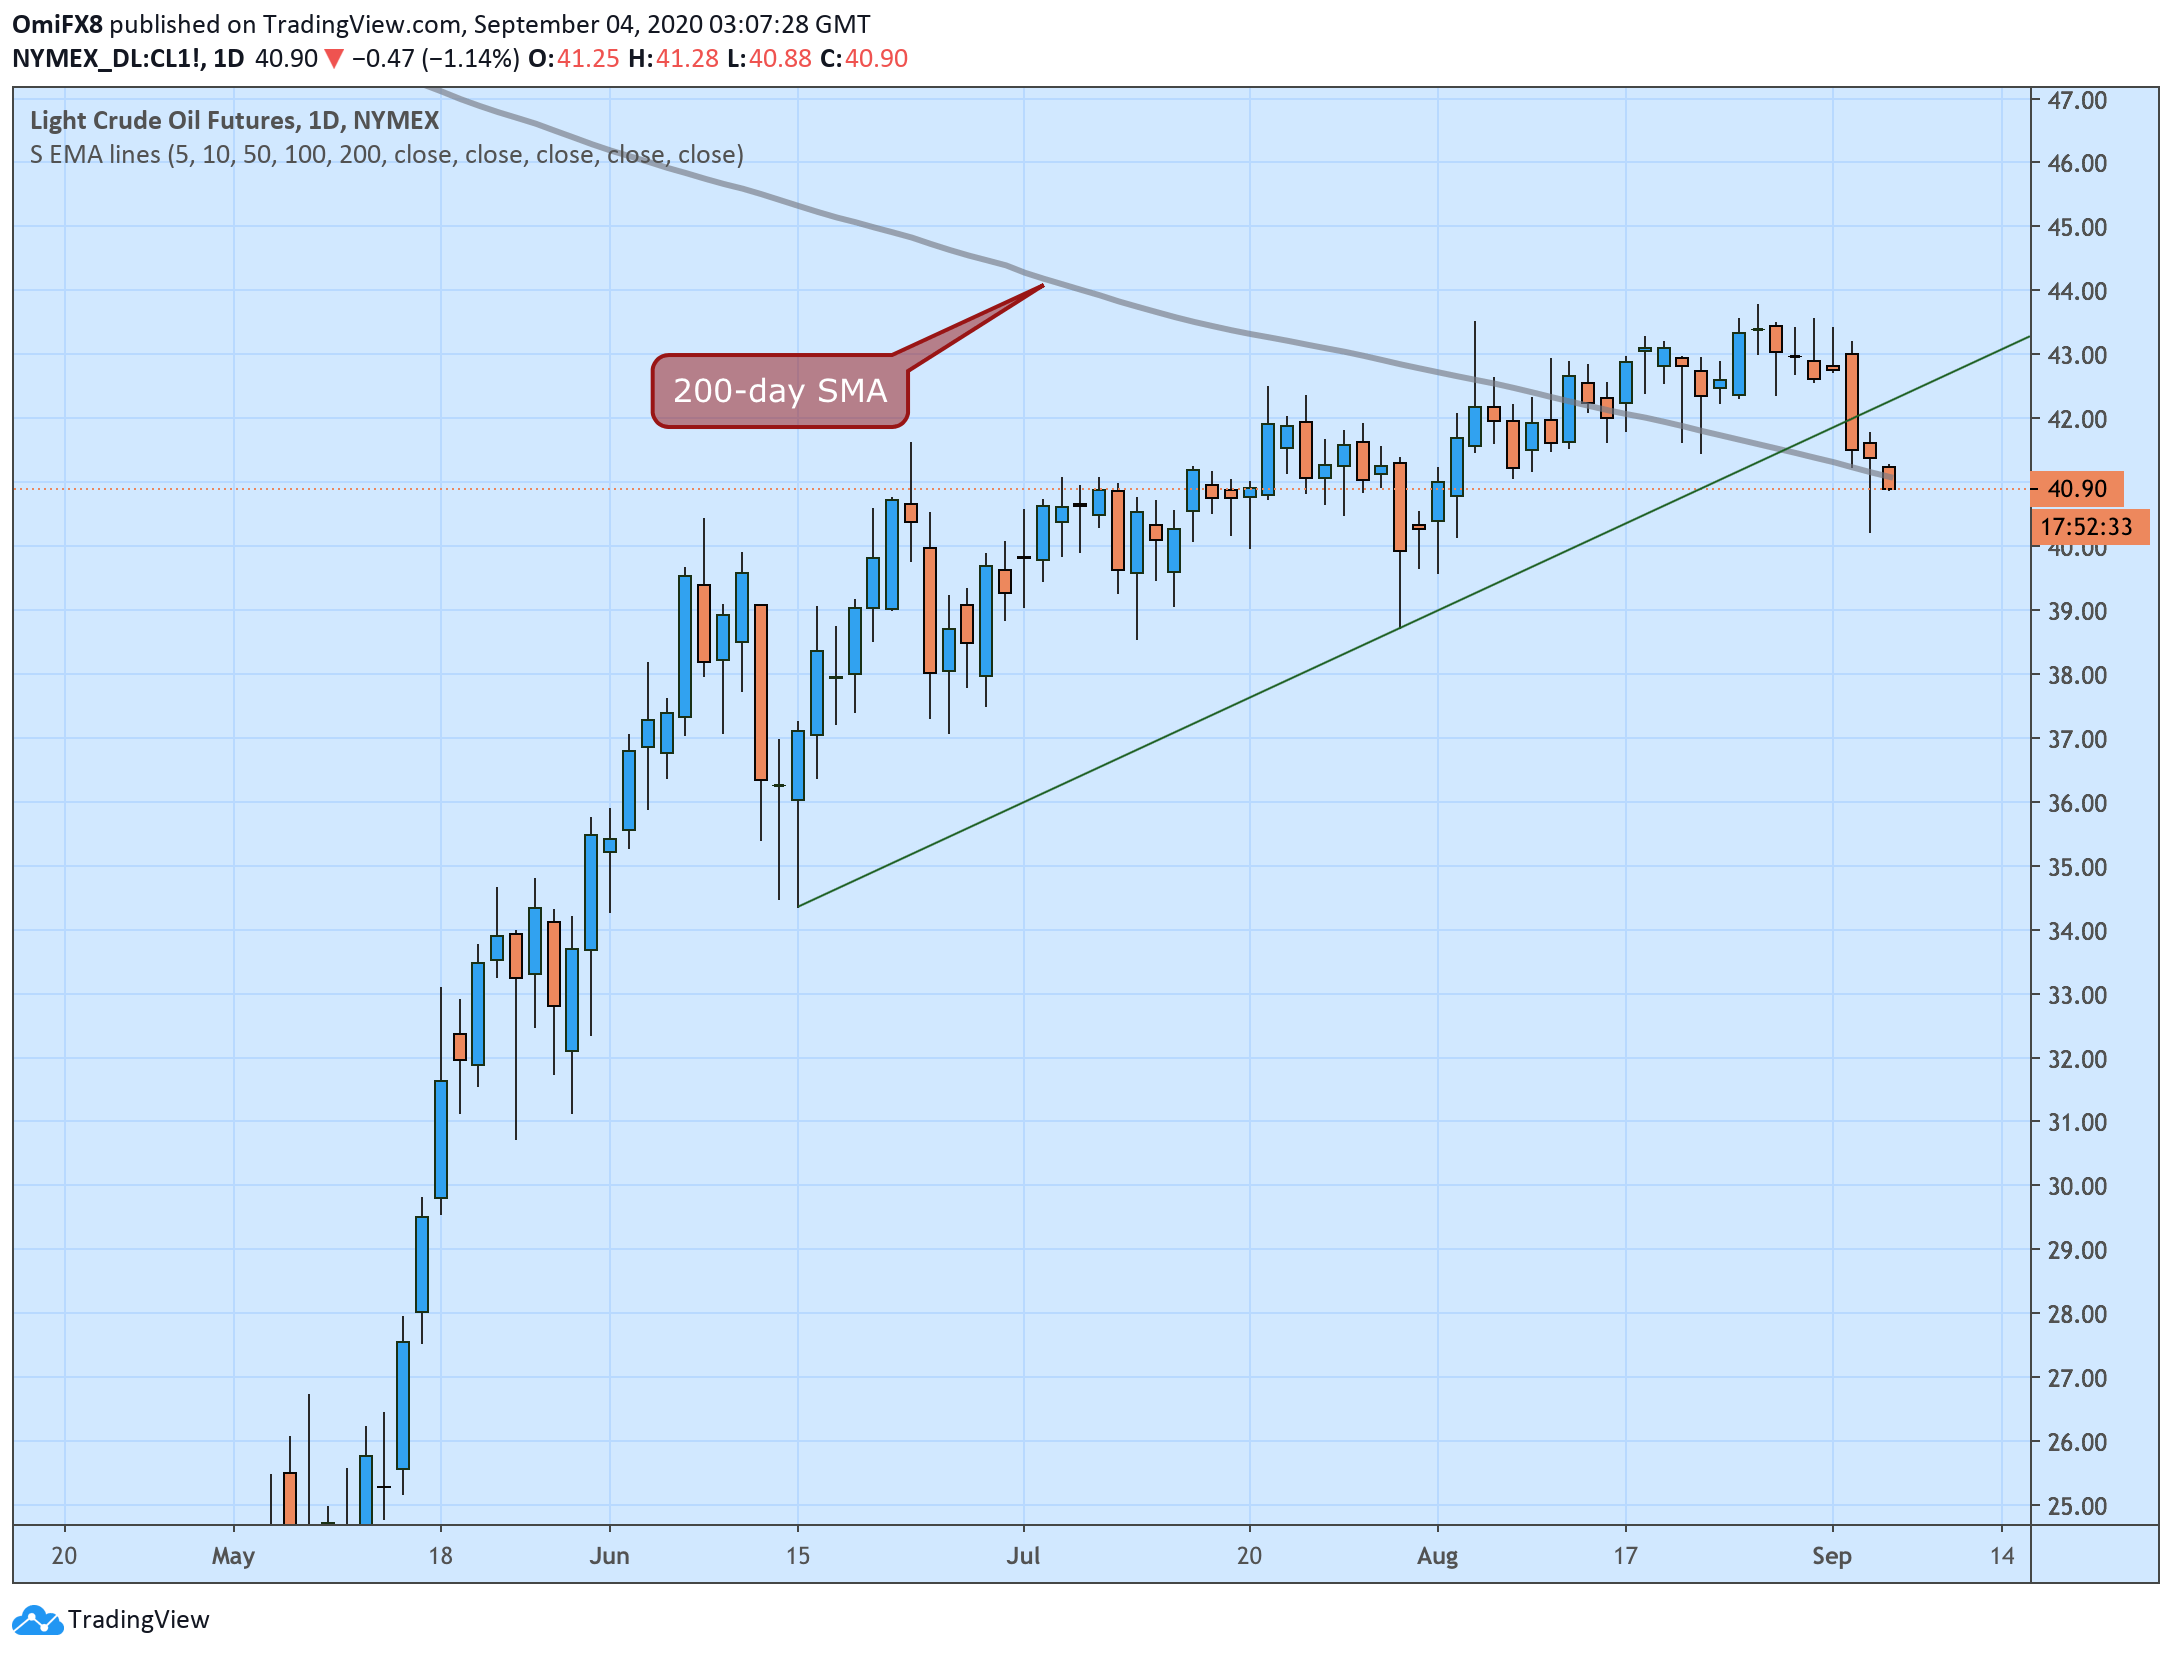
West Texas Intermediate (WTI) crude, the North American oil benchmark, is trading below the 200-day simple moving average (SMA) at $41.10.

The long-term average was breached on Thursday. However, the selling pressure ran out of steam at $40.22, and prices bounced back to levels above $41 early Friday only to turn lower again.

The black gold created a candle with a long lower wick on Thursday, aborting the immediate bearish view put forward by the downside break of an ascending trendline confirmed earlier this week

The focus now is on Friday's close. Acceptance below Thursday's low of $40.22 would revive the immediate bearish view and expose support at $38.72 (July 30 low). 

On the other hand, a close above Thursday's high of $41.79 would confirm reversal higher and allow a re-test of 43.78 (Aug. 26 high). 

Daily chart

Trend: Neutral

Technical levels

WTI

Overview
Today last price40.90
Today Daily Change-0.36
Today Daily Change %-0.87
Today daily open41.47
 
Trends
Daily SMA2042.63
Daily SMA5041.52
Daily SMA10036.01
Daily SMA20041.97
 
Levels
Previous Daily High41.99
Previous Daily Low40.45
Previous Weekly High43.86
Previous Weekly Low42.3
Previous Monthly High43.86
Previous Monthly Low39.75
Daily Fibonacci 38.2%41.04
Daily Fibonacci 61.8%41.4
Daily Pivot Point S140.61
Daily Pivot Point S239.76
Daily Pivot Point S339.07
Daily Pivot Point R142.16
Daily Pivot Point R242.85
Daily Pivot Point R343.71

Author

Omkar Godbole

Omkar Godbole

FXStreet Contributor

Omkar Godbole, editor and analyst, joined FXStreet after four years as a research analyst at several Indian brokerage companies.

More from Omkar Godbole
Share:

Editor's Picks

EUR/USD holds above 1.1750 after mixed EU PMI data

EUR/USD manages to hold above 1.1750 but struggles to gather recovery momentum on Friday, following the mixed February PMI figures from Germany and the Eurozone. In the second half of the day, Q4 GDP, December inflation and February PMI data from the US will be watched closely by market participants.

GBP/USD recovers further toward 1.3500 after UK PMI data

GBP/USD is recovering ground further toward 1.3500 in European trading on Friday, helped by a modest uptick in the Pound Sterling after stronger-than-expected UK January Retail Sales and February PMI data. However, the pair's further upside could be limited amid persistent US Dollar strength as the focus turns to key US data. 

Gold sticks to positive bias above $5,000 ahead of US data

Gold gains some positive traction for the third consecutive day on Friday. holding above $5,000. Traders now look forward to the key US macro releases – the Advance Q4 GDP report and the Personal Consumption Expenditures (PCE) Price Index – for fresh trading impetus. 

US GDP growth expected to slow down significantly in Q4 after stellar Q3 

The United States Bureau of Economic Analysis will publish the first preliminary estimate of the fourth-quarter Gross Domestic Product at 13:30 GMT. Analysts forecast the US economy to have expanded at a 3% annualized rate, slowing down from the 4.4% growth posted in the previous quarter.

Iran tensions and AI fears at the forefront ahead of key US data

Thursday’s scorecard shows major US Stock benchmarks closed modestly in the red amid mounting US-Iran tensions and AI disruption worries. The S&P 500 shed 19 points (0.3%) to 6,861, the Nasdaq 100 lost 101 points (0.4%) to 24,797, and the Dow Jones Industrial Average dropped 267 points (0.5%) to 49,395.

Official Trump price approaches breakout with mixed signals from traders

Official Trump (TRUMP) is trading at $3.50 at the time of writing, approaching its upper consolidation range. A breakout from this range could open the door for an upside move. On-chain data shows market indecision, with balanced flows between bulls and bears, signaling a lack of clear directional bias.