WTI Price Analysis: Oil drops below $70.00 but 100-HMA prods bears


  • WTI licks its wounds after posting the first daily loss in four.
  • U-turn from one-week-old resistance line breaks 200-HMA and joins downbeat oscillators to favor sellers.
  • 100-HMA offers breathing space to bears before directing them to multi-month low.
  • Bulls need successful break of $72.70 for confirmation.

WTI crude oil flirts with the 200-HMA as bears take a breather after returning to the table, following a three-day absence, during early Friday. In doing so, the black gold consolidates the previous day’s U-turn from a one-week high amid a sluggish Asian session.

That said, the quote reversed from an upward-sloping resistance line from March 16 the previous day to welcome bears. The downside move gained momentum after breaking the 200-Hour Moving Average (HMA). It should be noted that the bearish MACD signals and the downbeat RSI (14) line, not oversold, also back the energy benchmark’s latest weakness.

Hence, the quote’s corrective bounce remains elusive unless crossing the aforementioned resistance line, near $71.80 at the latest.

Even so, the mid-March swing high and 50% Fibonacci retracement of the commodity’s fall from March 07 to 20, around $72.70 by the press time, appears crucial for the WTI crude oil buyers to retake control.

Alternatively, the 100-HMA level of $68.65 puts a floor under the WTI crude oil price, a break of which could direct bears towards the seven-day-old horizontal support area surrounding $66.00-65.45.

In a case where the quote resists bouncing off the stated key support, the odds of witnessing a slump to refresh the multi-day low marked earlier in the week, around $64.40, can’t be ruled out.

WTI: Hourly chart

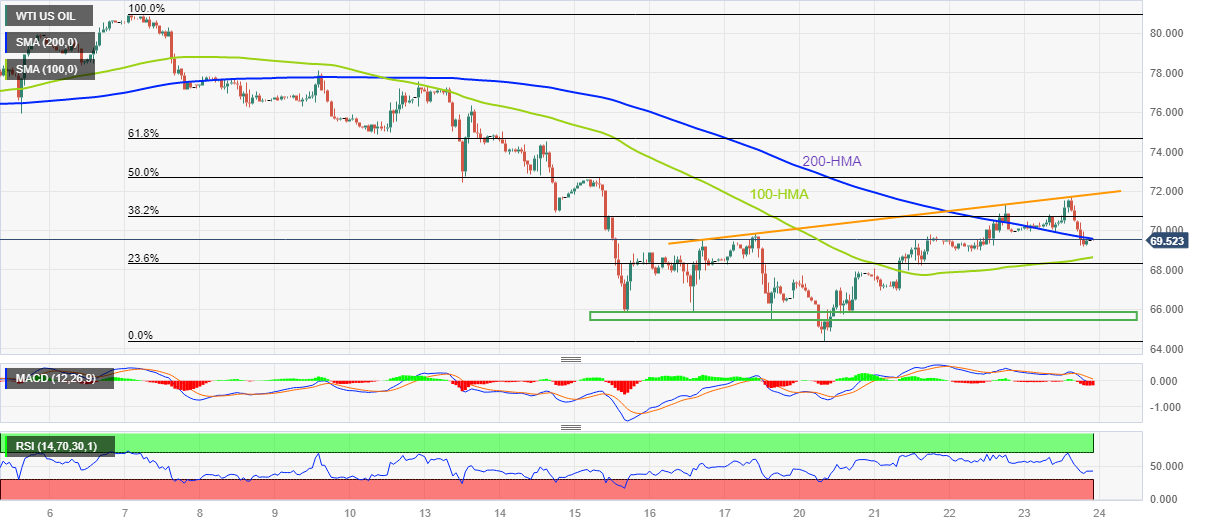
Trend: Further downside expected

Additional important levels

Overview
Today last price 69.52
Today Daily Change -0.41
Today Daily Change % -0.59%
Today daily open 69.93
 
Trends
Daily SMA20 74.24
Daily SMA50 76.83
Daily SMA100 78.04
Daily SMA200 84.87
 
Levels
Previous Daily High 71.33
Previous Daily Low 68.92
Previous Weekly High 77.55
Previous Weekly Low 65.44
Previous Monthly High 80.75
Previous Monthly Low 72.5
Daily Fibonacci 38.2% 70.41
Daily Fibonacci 61.8% 69.84
Daily Pivot Point S1 68.79
Daily Pivot Point S2 67.65
Daily Pivot Point S3 66.38
Daily Pivot Point R1 71.2
Daily Pivot Point R2 72.47
Daily Pivot Point R3 73.61


Share: Feed news

Information on these pages contains forward-looking statements that involve risks and uncertainties. Markets and instruments profiled on this page are for informational purposes only and should not in any way come across as a recommendation to buy or sell in these assets. You should do your own thorough research before making any investment decisions. FXStreet does not in any way guarantee that this information is free from mistakes, errors, or material misstatements. It also does not guarantee that this information is of a timely nature. Investing in Open Markets involves a great deal of risk, including the loss of all or a portion of your investment, as well as emotional distress. All risks, losses and costs associated with investing, including total loss of principal, are your responsibility. The views and opinions expressed in this article are those of the authors and do not necessarily reflect the official policy or position of FXStreet nor its advertisers. The author will not be held responsible for information that is found at the end of links posted on this page.

If not otherwise explicitly mentioned in the body of the article, at the time of writing, the author has no position in any stock mentioned in this article and no business relationship with any company mentioned. The author has not received compensation for writing this article, other than from FXStreet.

FXStreet and the author do not provide personalized recommendations. The author makes no representations as to the accuracy, completeness, or suitability of this information. FXStreet and the author will not be liable for any errors, omissions or any losses, injuries or damages arising from this information and its display or use. Errors and omissions excepted.

The author and FXStreet are not registered investment advisors and nothing in this article is intended to be investment advice.

Recommended content


Recommended content

Editors’ Picks

EUR/USD fluctuates near 1.0700 after US data

EUR/USD fluctuates near 1.0700 after US data

EUR/USD stays in a consolidation phase at around 1.0700 in the American session on Wednesday. The data from the US showed a strong increase in Durable Goods Orders, supporting the USD and making it difficult for the pair to gain traction.

EUR/USD News

USD/JPY refreshes 34-year high, attacks 155.00 as intervention risks loom

USD/JPY refreshes 34-year high, attacks 155.00 as intervention risks loom

USD/JPY is renewing a multi-decade high, closing in on 155.00. Traders turn cautious on heightened risks of Japan's FX intervention. Broad US Dollar rebound aids the upside in the major. US Durable Goods data are next on tap. 

USD/JPY News

Gold stays in consolidation above $2,300

Gold stays in consolidation above $2,300

Gold finds it difficult to stage a rebound midweek following Monday's sharp decline but manages to hold above $2,300. The benchmark 10-year US Treasury bond yield stays in the green above 4.6% after US data, not allowing the pair to turn north.

Gold News

Worldcoin looks set for comeback despite Nvidia’s 22% crash Premium

Worldcoin looks set for comeback despite Nvidia’s 22% crash

Worldcoin price is in a better position than last week's and shows signs of a potential comeback. This development occurs amid the sharp decline in the valuation of the popular GPU manufacturer Nvidia.

Read more

Three fundamentals for the week: US GDP, BoJ and the Fed's favorite inflation gauge stand out Premium

Three fundamentals for the week: US GDP, BoJ and the Fed's favorite inflation gauge stand out

While it is hard to predict when geopolitical news erupts, the level of tension is lower – allowing for key data to have its say. This week's US figures are set to shape the Federal Reserve's decision next week – and the Bank of Japan may struggle to halt the Yen's deterioration. 

Read more

Forex MAJORS

Cryptocurrencies

Signatures