|

WTI Price Analysis: Oil bears approach $68.30 support within six-week-old triangle

  • WTI takes offers to refresh intraday low, down for the third consecutive day in a row.
  • Fears of higher Oil supply, back of demand join US Dollar rebound to please bears.
  • Sustained trading below the key moving averages, mostly steady RSI suggest further downside of energy benchmark.
  • Bulls remain cautious below $83.40; $64.30 can prod WTI bears.

WTI renews its intraday low around $69.50 as it drops for the third consecutive day heading into Monday’s European session. In doing so, the black gold justifies fears of oversupply and lack of energy demand amid the sluggish market conditions.

Also read: WTI bears attack $70.00 as Oil producers, major economics shake demand-supply matrix

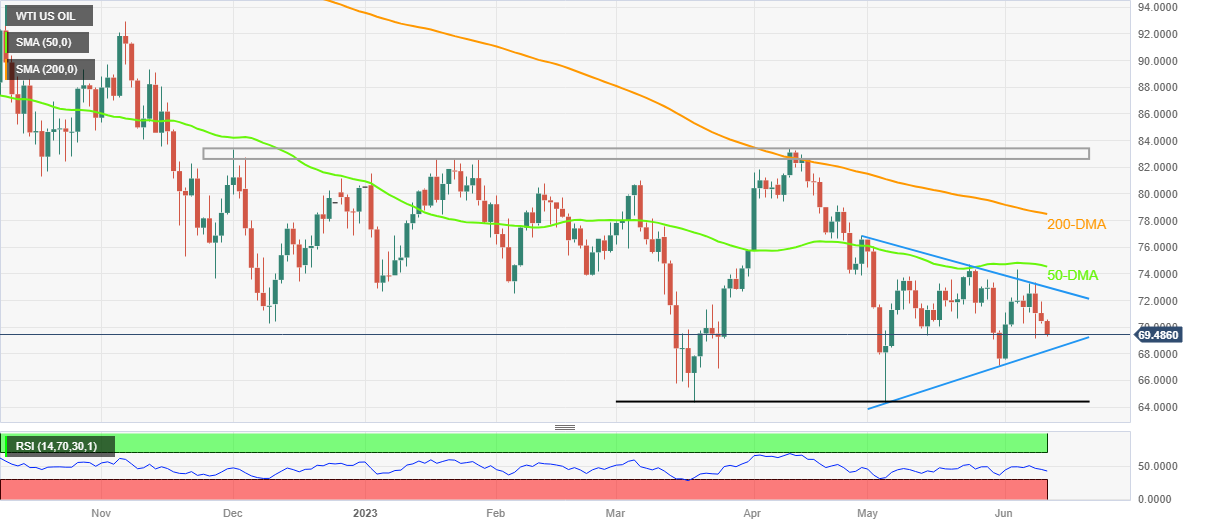
That said, the steady RSI (14) line and the black gold’s inability to cross the 50-DMA, as well as the 200-DMA, keeps the energy benchmark on the bear’s radar.

Even so, a 1.5-month-old symmetrical triangle restricts immediate Oil moves between $73.00 and $68.30.

Should the quote breaks the triangle formation towards the south, the double bottoms around $64.30, appear a tough nut to crack for the Oil sellers to crack before retaking control.

On the flip side, a clear run-up beyond the stated triangle’s top line, currently around $73.00, could challenge the 50-DMA hurdle of $74.55.

Following that, the 200-DMA level surrounding $78.50 and the $80.00 round figure can challenge WTI bulls.

It’s worth noting, however, that a broad resistance area comprising multiple levels marked since early December 2022, between $83.40 and $82.60, could challenge the black gold’s further upside past $80.00.

WTI crude oil: Daily chart

Trend: Limited downside expected

Additional important levels

Overview
Today last price69.49
Today Daily Change-0.97
Today Daily Change %-1.38%
Today daily open70.46
 
Trends
Daily SMA2071.66
Daily SMA5074.67
Daily SMA10075.28
Daily SMA20078.58
 
Levels
Previous Daily High71.9
Previous Daily Low70.24
Previous Weekly High74.36
Previous Weekly Low69.17
Previous Monthly High76.61
Previous Monthly Low64.31
Daily Fibonacci 38.2%70.88
Daily Fibonacci 61.8%71.27
Daily Pivot Point S169.83
Daily Pivot Point S269.2
Daily Pivot Point S368.17
Daily Pivot Point R171.5
Daily Pivot Point R272.53
Daily Pivot Point R373.16

Author

Anil Panchal

Anil Panchal

FXStreet

Anil Panchal has nearly 15 years of experience in tracking financial markets. With a keen interest in macroeconomics, Anil aptly tracks global news/updates and stays well-informed about the global financial moves and their implications.

More from Anil Panchal
Share:

Markets move fast. We move first.

Orange Juice Newsletter brings you expert driven insights - not headlines. Every day on your inbox.

By subscribing you agree to our Terms and conditions.

Editor's Picks

EUR/USD eases toward 1.1700 as USD finds fresh demand

EUR/USD eases toward the 1.1700 mark in early Europe on Friday. The pair faces headwinds from a renewed uptick in the US Dollar as investors look past softer US inflation data. However, the EUR/USD downside appears capped by expectations of Fed-ECB monetary policy divergence. 

GBP/USD steadies below 1.3400 as traders digest BoE policy update and US inflation data

The GBP/USD pair stalls the previous day's pullback from the vicinity of mid-1.3400s and a nearly two-month high, though it struggles to attract meaningful buyers during the Asian session on Friday. Spot prices currently trade around the 1.3380-1.3385 region, up only 0.05% for the day, amid mixed cues.

Gold seems vulnerable as USD bulls shrug off softer US CPI

Gold extends the previous day's late pullback from the vicinity of the record high and attracts some follow-through selling during the Asian session on Friday. The US CPI report released on Thursday pointed to cooling of inflationary pressure.

Bitcoin, Ethereum and Ripple correction slide as BoJ rate decision weighs on sentiment

Bitcoin, Ethereum, and Ripple are extending their correction phases after losing nearly 3%, 8%, and 10%, respectively, through Friday. The pullback phase is further strengthened as the upcoming Bank of Japan’s rate decision on Friday weighs on risk sentiment, with BTC breaking key support, ETH deepening weekly losses, and XRP sliding to multi-month lows.

Bank of England cuts rates in heavily divided decision

The Bank of England has cut rates to 3.75%, but the decision was more hawkish than expected, leaving market rates higher and sterling slightly stronger. It's a close call whether the Bank cuts again in February or March.

Ethereum Price Forecast: EF outlines ways to solve growing state issues

Ethereum price today: $2,920. The EF noted that Ethereum's growing state could lead to centralization and weaken censorship resistance. The Stateless Consensus team outlined state expiry, state archive and partial statelessness as potential solutions to the growing state load.