XRP slumps toward $1.00 as ETF outflows, weak technicals fuel bearish outlook
- XRP remains under pressure, trading around $1.15 on Thursday, weighed down by geopolitical pressure and uncertainty.
- XRP institutional investors scaled back their risk exposure, with ETF outflows totaling $5 million on Wednesday.
- XRP faces a weakening technical structure amid an oversold RSI and a MACD sell signal.

Ripple (XRP) edges lower, trading around $1.15 at the time of writing on Thursday, its lowest price since February 6. The cross-border money remittance token is extending the sell-off for the fifth consecutive day, reflecting persistent headwinds from ongoing geopolitical tensions and investor uncertainty.
XRP ETF outflows reinforce bearish outlook
Institutional interest in XRP spot Exchange-Traded Funds (ETFs) took a negative turn, with roughly $5 million in outflows on Wednesday. According to SoSoValue data, this marks the first outflow since April 30.
Cumulative inflows into XRP investment products stand at $1.42 billion, while average assets under management hover around $1.03 billion, underscoring sustained institutional interest despite recent market volatility.
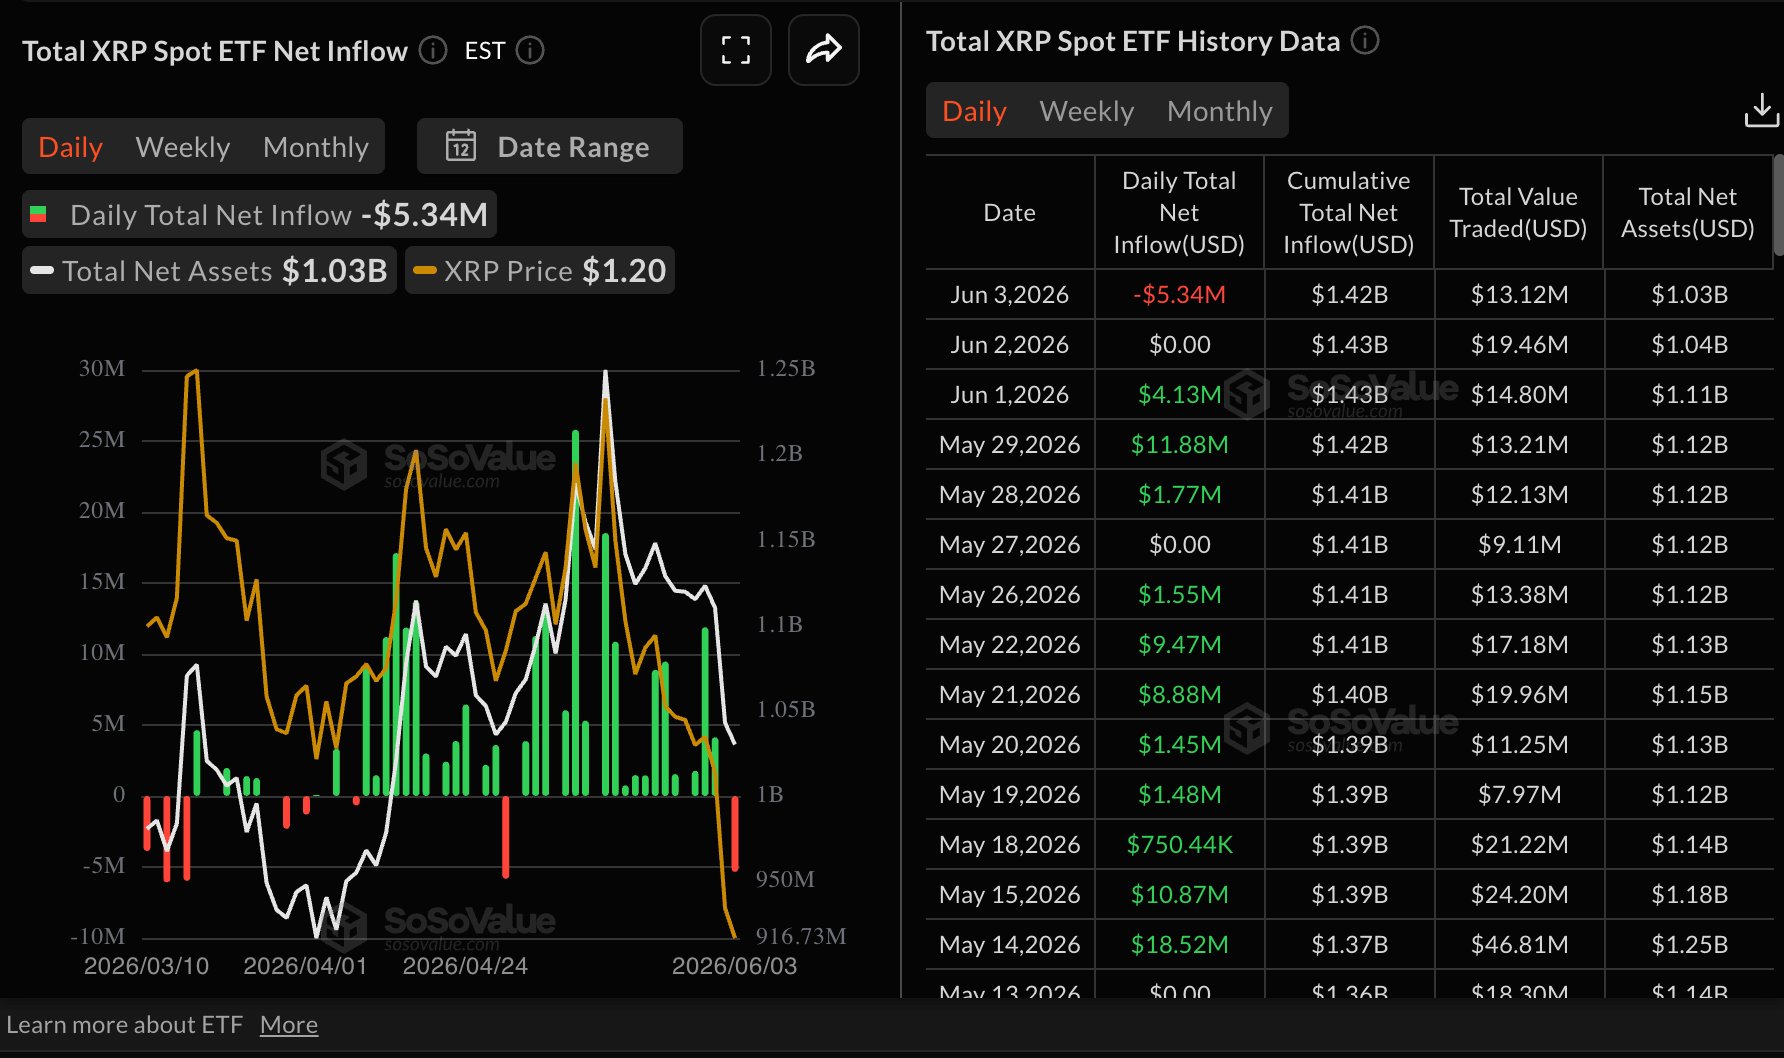
Should risk aversion continue and institutional investors further trim their exposure, increased supply pressure could accelerate XRP’s decline below the tentative $1.00 support level.
“Tensions between the United States and Iran continue to generate concern across global financial markets, triggering recurring episodes of risk aversion,” Simon-Peter Massabni, Head of Business Development at XS.com, said in a written statement. “In such environments, investors typically reduce exposure to more volatile assets, such as cryptocurrencies, while favoring more defensive positions,” he added.
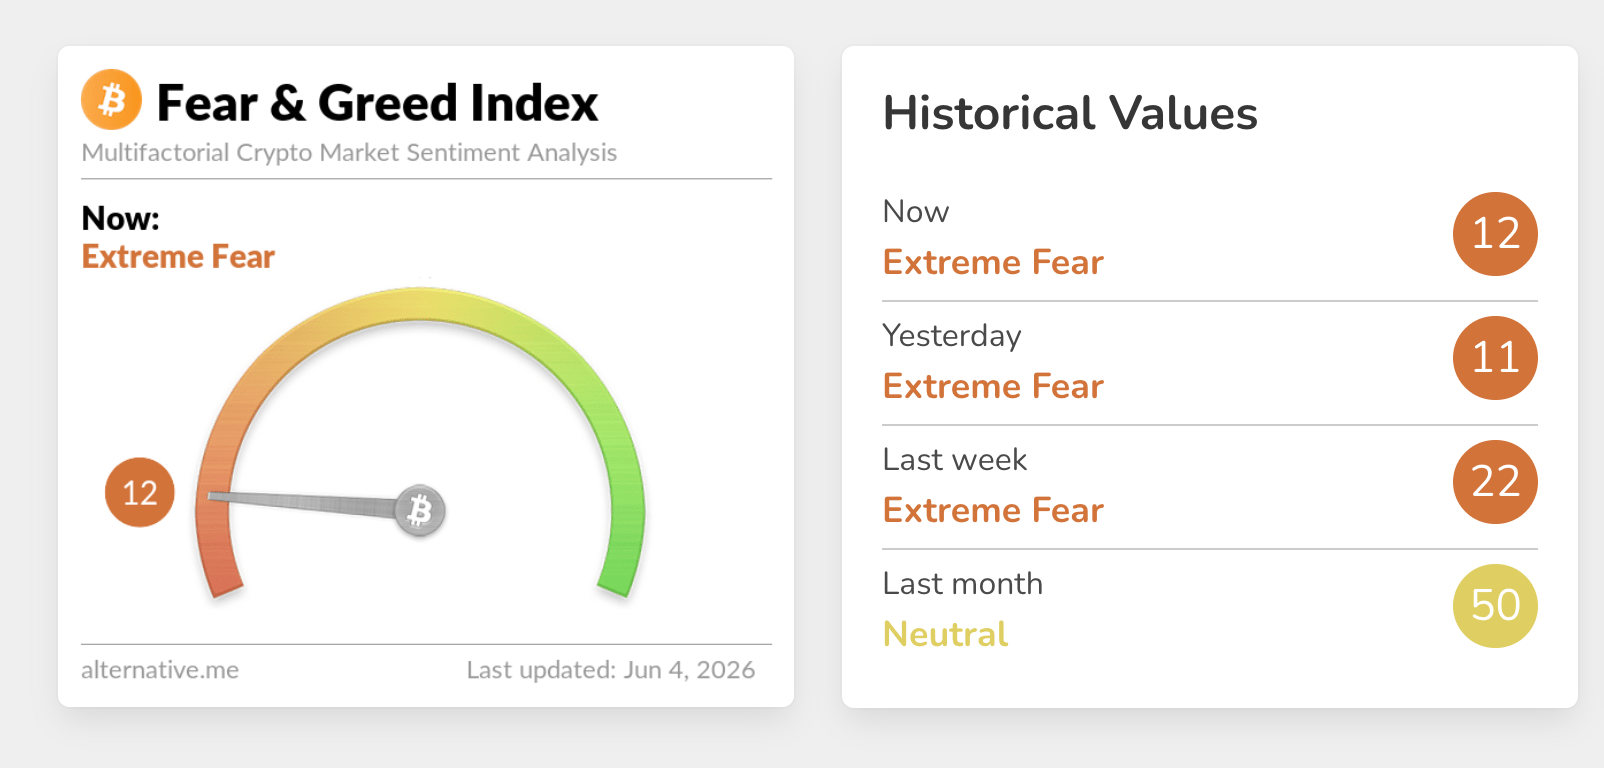
Sentiment across the crypto market remains significantly subdued, as reflected in the Fear & Greed Index, holding at 12 in Extreme Fear territory on Thursday, down from 50 in May.
Price analysis: XRP stuck in a persistent drawdown
XRP trades at $1.15, holding well below the 50-day, 100-day and 200-day Exponential Moving Averages (EMAs), keeping the near-term bias bearish as rallies struggle against a dense band of overhead supply.
The SuperTrend line at $1.34 also sits above spot, reinforcing a downside-skewed structure, while the Relative Strength Index (RSI) near 22 on the daily chart suggests deeply oversold conditions that may slow, but not yet reverse, the prevailing downtrend, especially with the Moving Average Convergence Divergence (MACD) histogram in negative territory.
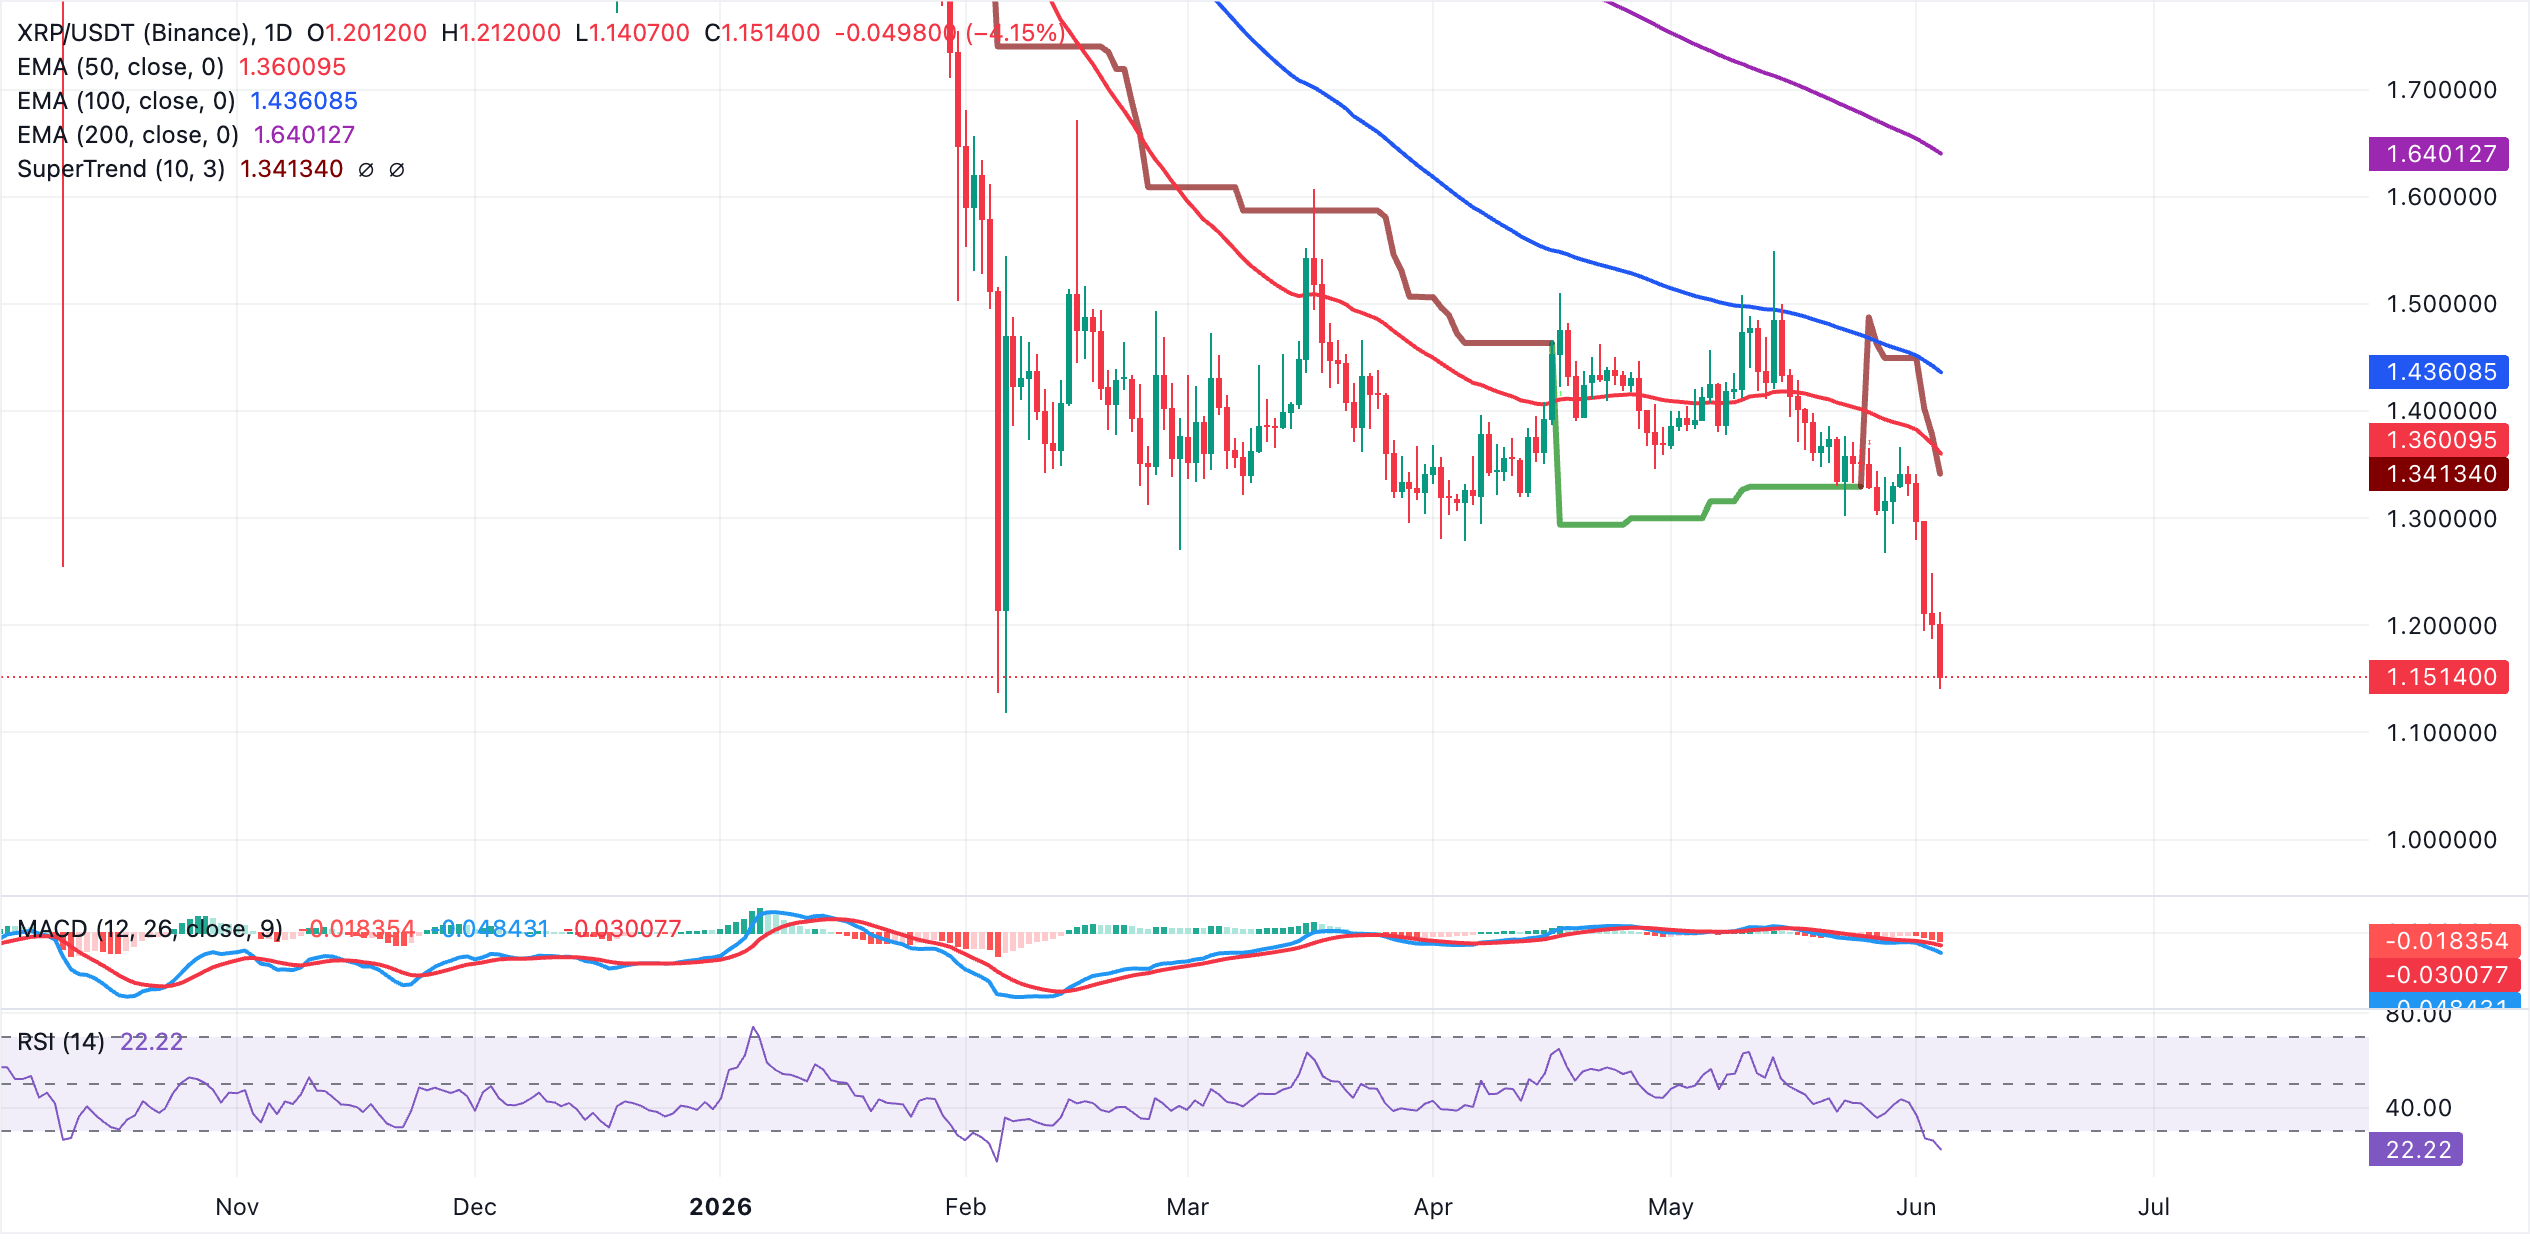
On the topside, initial resistance is seen at the SuperTrend barrier around $1.34, with the 50-day EMA nearby at $1.36 forming the next cap if a corrective bounce materializes. Further up, the 100-day EMA at roughly $1.44 and the more distant 200-day EMA near $1.64 outline subsequent resistance tiers that would need to be reclaimed to ease the broader bearish pressure.
(The technical analysis of this story was written with the help of an AI tool.)
Cryptocurrency metrics FAQs
The developer or creator of each cryptocurrency decides on the total number of tokens that can be minted or issued. Only a certain number of these assets can be minted by mining, staking or other mechanisms. This is defined by the algorithm of the underlying blockchain technology. On the other hand, circulating supply can also be decreased via actions such as burning tokens, or mistakenly sending assets to addresses of other incompatible blockchains.
Market capitalization is the result of multiplying the circulating supply of a certain asset by the asset’s current market value.
Trading volume refers to the total number of tokens for a specific asset that has been transacted or exchanged between buyers and sellers within set trading hours, for example, 24 hours. It is used to gauge market sentiment, this metric combines all volumes on centralized exchanges and decentralized exchanges. Increasing trading volume often denotes the demand for a certain asset as more people are buying and selling the cryptocurrency.
Funding rates are a concept designed to encourage traders to take positions and ensure perpetual contract prices match spot markets. It defines a mechanism by exchanges to ensure that future prices and index prices periodic payments regularly converge. When the funding rate is positive, the price of the perpetual contract is higher than the mark price. This means traders who are bullish and have opened long positions pay traders who are in short positions. On the other hand, a negative funding rate means perpetual prices are below the mark price, and hence traders with short positions pay traders who have opened long positions.
Author

John Isige
FXStreet
John Isige is a seasoned cryptocurrency journalist and markets analyst committed to delivering high-quality, actionable insights tailored to traders, investors, and crypto enthusiasts. He enjoys deep dives into emerging Web3 tren



