WTI Price Analysis: Monthly support line backs reversal towards $71.00
- WTI recovers from weekly low, refreshes intraday top of late.
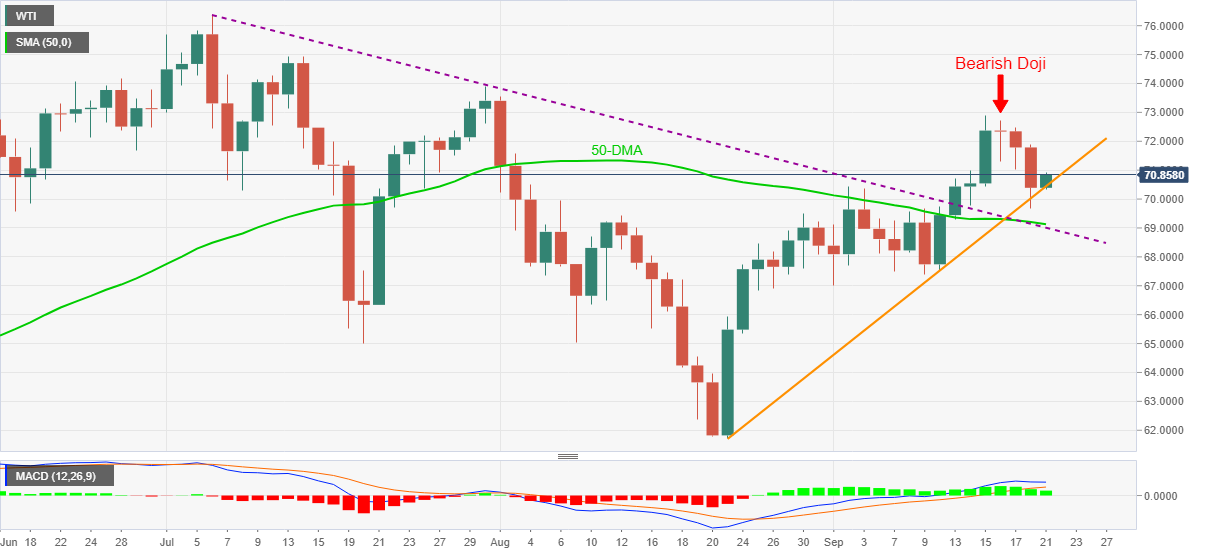
- Bullish MACD, short-term key support line favor recovery moves.
- Convergence of previous resistance line, 50-DMA adds to the downside support.
- Bullish Doji’s top challenges the advances towards monthly high.

WTI extends rebound from a one-month-old support line towards $71.00, up 0.53% on a day around $70.70 by the press time of the pre-European session on Tuesday.
The commodity’s recovery moves also gain support from bullish MACD signals aim at the rejection of last week’s bearish candlestick formation, by an upside clearance of $72.75.
Following that, the monthly high near $72.90 and late July tops close to $73.90 will challenge the oil buyers.
Meanwhile, a downside break of the stated support line, around $70.40, will have to get validation from the $70.00 threshold to recall the black gold bears.
Even so, a convergence of a downward sloping trend line from early July and 50-DMA, around $69.10, will be a tough nut to crack for WTI bears.
Overall, the quote remains in recovery mode but on a bumpy road to the north.
WTI: Daily chart
Trend: Further recovery expected
Author

Anil Panchal
FXStreet
Anil Panchal has nearly 15 years of experience in tracking financial markets. With a keen interest in macroeconomics, Anil aptly tracks global news/updates and stays well-informed about the global financial moves and their implications.


