|

WTI Price Analysis: Mildly offered below $77.00 on Wednesday’s Gravestone Doji

  • WTI pulls back from six-week high, pressured around intraday low at the latest.
  • Bearish candlestick, sluggish RSI hints at buyer’s exhaustion below multi-day-old resistance line.
  • 50-DMA, 100-DMA restricts immediate downside ahead of monthly support line.

WTI crude oil remains on the back foot near the intraday low of $76.56, down 0.20% on a day during early Thursday.

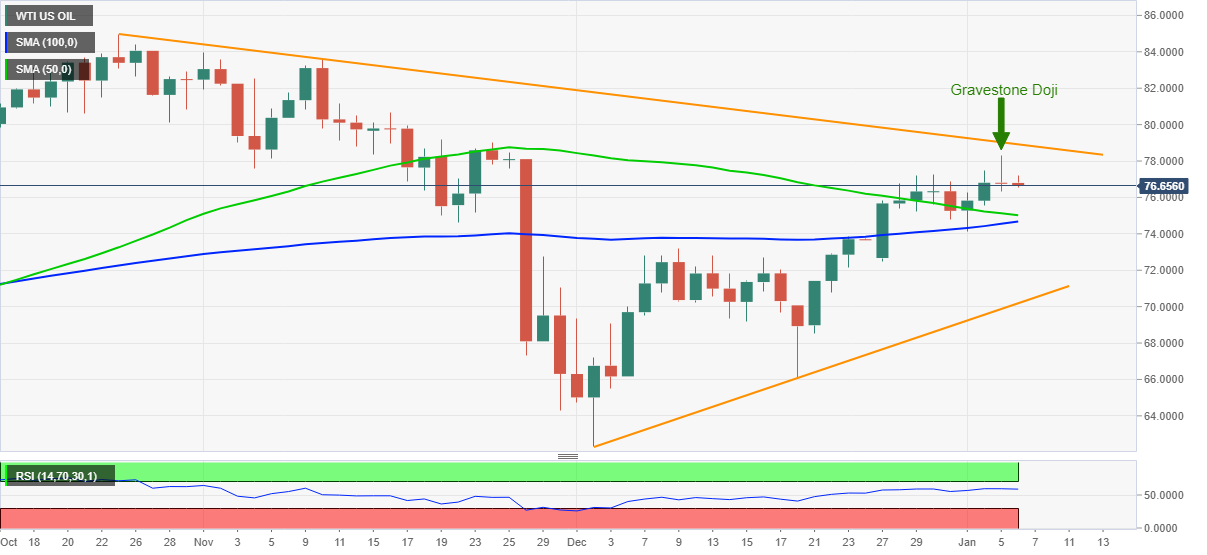
The oil benchmark jumped to a fresh high since November 25 the previous day before reversing gain from $78.30 to retest the opening levels at Wednesday’s end. In doing so, the black gold printed a Gravestone Doji bearish candlestick on the daily chart.

Given the sluggish RSI conditions backing the bearish candlestick below a 10-week-old resistance line, around $78.95, WTI oil prices are likely to decline further.

In doing so, the 50-DMA and the 100-DMA can lure short-term traders, respectively around $75.00 and $74.65.

However, early December’s peak near $73.15 and a one-month-old support line, close to $70.20, will challenge WTI bears afterward.

Alternatively, an upside clearance of the stated resistance line near $78.95 will need validation from the $79.00 round figure before directing the oil prices towards $83.60 and then to November’s high surrounding $84.00.

During the rise, the $80.00 psychological manget will act as an extra filter to the north.

WTI: Daily chart

Trend: Further weakness expected

Additional important levels

Overview
Today last price76.62
Today Daily Change-0.17
Today Daily Change %-0.22%
Today daily open76.79
 
Trends
Daily SMA2073.32
Daily SMA5075.13
Daily SMA10074.55
Daily SMA20071.08
 
Levels
Previous Daily High78.3
Previous Daily Low76.34
Previous Weekly High77.26
Previous Weekly Low72.46
Previous Monthly High77.26
Previous Monthly Low62.34
Daily Fibonacci 38.2%77.09
Daily Fibonacci 61.8%77.55
Daily Pivot Point S175.99
Daily Pivot Point S275.18
Daily Pivot Point S374.03
Daily Pivot Point R177.95
Daily Pivot Point R279.1
Daily Pivot Point R379.9

Author

Anil Panchal

Anil Panchal

FXStreet

Anil Panchal has nearly 15 years of experience in tracking financial markets. With a keen interest in macroeconomics, Anil aptly tracks global news/updates and stays well-informed about the global financial moves and their implications.

More from Anil Panchal
Share:

Editor's Picks

AUD/USD falls to near 0.7100 after slipping below 50-day EMA

AUD/USD depreciates after registering minor gains in the previous day, trading around 0.7120 during the Asian hours. The technical analysis of the daily chart shows the pair consolidating sideways within a rectangle pattern, as neither bulls nor bears gain control. The AUD/USD pair is holding a slight bearish tone however as it sits beneath both the nine-day and 50-day EMAs.

160.00: USD/JPY back near intervention territory after upbeat US jobs report

US Nonfarm Payrolls beat expectations by a wide margin in May, with 172K jobs added. The US Dollar rebounds after the release, helping USD/JPY recover from its intraday lows. Warnings from Japanese authorities continue to limit upside potential near the 160.00 threshold.

Gold targets $4,300 amid stronger Dollar

Gold faces increasing selling interest and navigates the area of three-month lows near the $4,300 mark per troy ounce on Friday. The precious metal’s decline comes as traders assess the stronger-than-expected NFP, while the bid bias in the Greenback and higher US Treasury yields also collaborate with the retracement.

Cardano hits five-year low even as Hoskinson clarifies "break" isn't an exit

Cardano (ADA) price is down 10% at press time on Friday, extending losses over 30% so far this week amid Charles Hoskinson's clarification that "break" isn't an exit.

Week ahead – Fed countdown begins amid US inflation data and geopolitical risks

Fed Chair Warsh’s first meeting approaches as key US inflation data could reshape expectations. Oil prices remain elevated as US-Iran talks continue; tariffs also return to the spotlight. ECB is expected to hike; will it be a one-off move or is July live?

The US economy defies the rules: 100 days into the Oil shock and the recession signal is still missing

More than three months after the start of the Iran war and the resulting disruption to global energy markets, the US economy continues to display remarkable resilience. The conflict has triggered a sharp rise in Oil prices, reignited inflationary pressures and fueled widespread concerns about a potential economic slowdown.