|

WTI Price Analysis: Immediate HMA confluence tests recovery moves around $65.50

  • WTI bounces off intraday low while trying to recover the previous day’s losses.
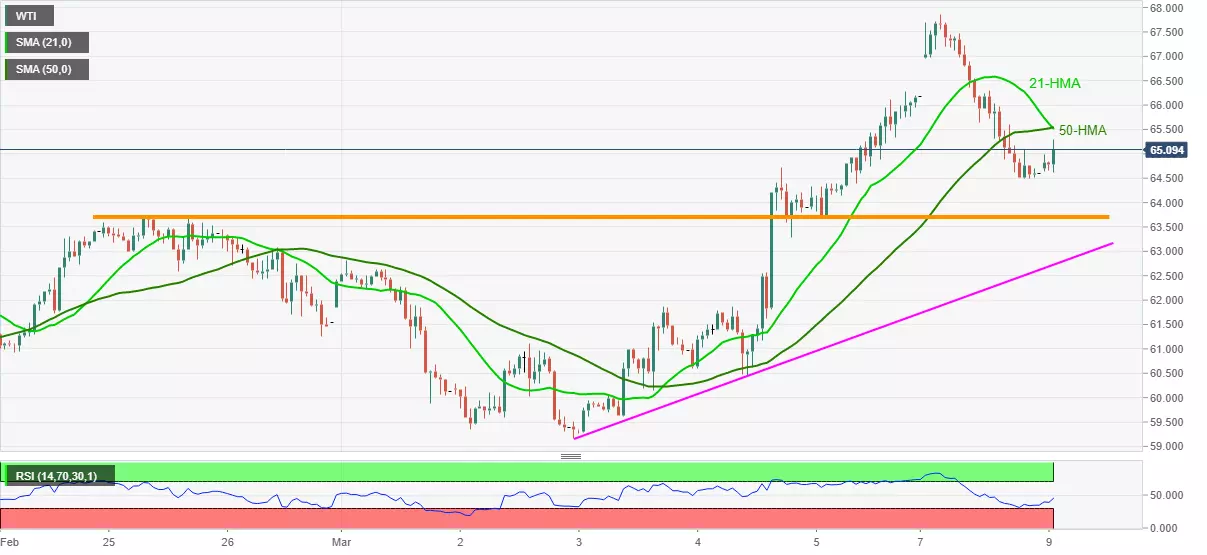
  • 21-HMA, 50-HMA guards nearby upside, two-week-old horizontal support will challenge sellers.

WTI holds $65.00, currently up 0.80% around $65.10, during early Tuesday. In doing so, the energy benchmark recovers from the intraday low while trying to trim Monday’s pullback moves from a multi-month high.

Although RSI’s U-turn from the oversold area, coupled with upbeat fundamentals, favor WTI bulls, a confluence of 21 and 50-HMA around $65.50-55 probes immediate upside of the black gold.

Also acting as a short-term resistance will be the $66.30, a break of which may not hesitate to refresh the highest levels marked since October 2018 while eyeing the $68.00 threshold.

Meanwhile, a horizontal area comprising February 25 highs and last Thursday’s lows around $63.80-65 can offer nearby support during the quote’s fresh declines.

Even if WTI sellers break strong horizontal support, a one-week-old ascending support line around $62.70 should challenge further downside ahead of highlighting the $60.00 psychological magnet for sellers.

WTI hourly chart

Trend: Bullish

Additional important levels

Overview
Today last price65.02
Today Daily Change0.45
Today Daily Change %0.70%
Today daily open64.57
 
Trends
Daily SMA2061.09
Daily SMA5055.82
Daily SMA10049.56
Daily SMA20044.96
 
Levels
Previous Daily High67.87
Previous Daily Low64.49
Previous Weekly High66.27
Previous Weekly Low59.17
Previous Monthly High63.72
Previous Monthly Low51.6
Daily Fibonacci 38.2%65.78
Daily Fibonacci 61.8%66.58
Daily Pivot Point S163.41
Daily Pivot Point S262.26
Daily Pivot Point S360.03
Daily Pivot Point R166.79
Daily Pivot Point R269.02
Daily Pivot Point R370.18

Author

Anil Panchal

Anil Panchal

FXStreet

Anil Panchal has nearly 15 years of experience in tracking financial markets. With a keen interest in macroeconomics, Anil aptly tracks global news/updates and stays well-informed about the global financial moves and their implications.

More from Anil Panchal
Share:

Editor's Picks

EUR/USD holds above 1.1850 ahead of US data

EUR/USD stabilizes above 1.1850 after suffering heavy losses to end the previous week. The pair remains vulnerable to further downside as the US Dollar stays firm following President Donald Trump’s nomination of Kevin Warsh as the next Fed Chair. The focus now shifts to the US ISM Manufacturing PMI data. 

GBP/USD recovers to 1.3700 region following earlier drop

GBP/USD clings to small daily gains near 1.3700 after sliding toward 1.3650 earlier in the day. Traders weigh what a Federal Reserve under Kevin Warsh might look like, helping the US Dollar stay resilient against its peers and limiting the pair's upside ahead of the ISM Manufacturing Purchasing Managers Index report from the US.

Gold rebounds from monthly-low, stays below $4,800

Gold recovers from the monthly low it touched near $4,400 at the weekly opening but remains in negative territory below $4,800. The precious metal continues its downtrend after reaching historic highs last week as Kevin Warsh's nomination as the next Fed chair eases concerns over the US central bank’s independence, bolstering the US Dollar recovery. US ISM PMI Manufacturing PMI data is awaited. 

Cardano dips below $0.28 as bears eye October 2023 lows

Cardano price trades in red, slipping below $0.28 at the time of writing on Monday, following a correction of more than 15% in the previous week. The broader crypto market remains under pressure, with Bitcoin slipping below $75,000 on Monday.

Warsh effect ripples through markets, central banks on deck this week

The first full month of the year is behind us, and, honestly, it has been rather more dramatic than most had anticipated when toasting the New Year. We wrapped up last week with US President Donald Trump announcing his Fed Chair pick. 

Bitcoin slips below $75,000 as selling pressure accelerates

Bitcoin (BTC) price falls below the $75,000 mark on Monday, having corrected nearly 11% in the previous week and reaching level not seen in nearly 10 months. Market momentum has clearly turned bearish, with technical indicators pointing to further downside toward the next key support at $70,000.