|

WTI Price Analysis: Extends pullback from 21-DMA below $76.00

  • WTI remains pressured around intraday low, defends previous day’s U-turn from two-week top.
  • Downbeat RSI conditions, pullback from short-term key DMA hints at further weakness.
  • 11-week-old bullish triangle gains major attention, highlighting $78.20 as the key hurdle.

WTI crude oil extends the previous day’s pullback from a two-week top as it drops to $75.70 while refreshing intraday low during early Friday morning in Europe.

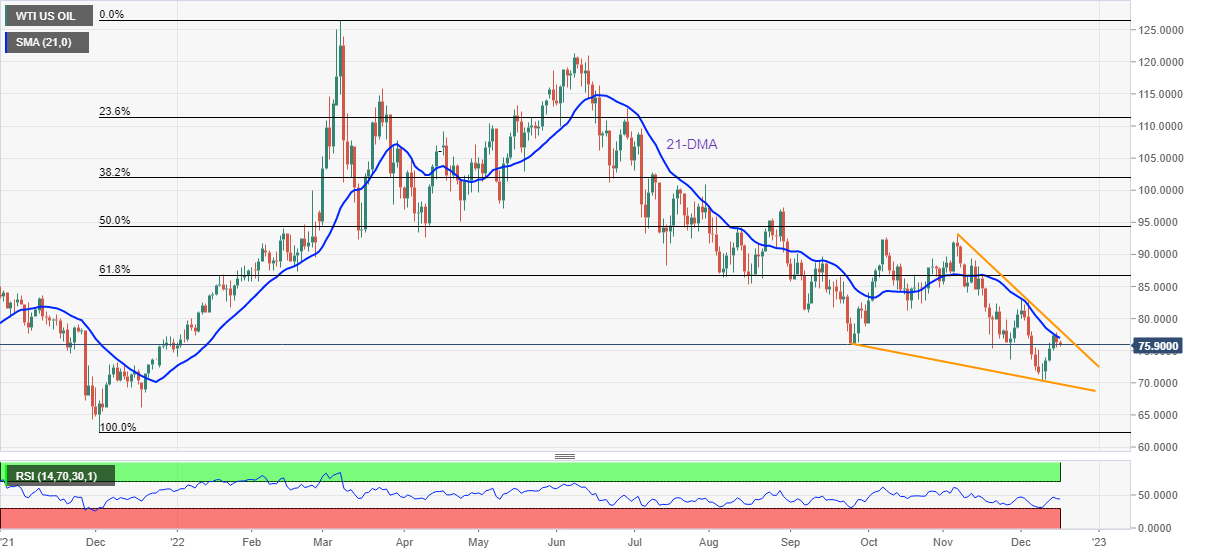
The black gold’s latest weakness could also be linked to the failure to cross the 21-DMA, around $77.00. Given the downbeat RSI conditions, the WTI crude oil price is likely to witness further selling pressure.

However, November’s low of around $73.65 could act as immediate support for the energy benchmark.

Following that, a downward-sloping trend line from September, forming part of the bullish triangle formation around $69.80, will gain the bear’s attention.

In a case where WTI remains weak past $69.80, the December 2021 low near $62.35 should lure the commodity sellers.

Alternatively, the 21-DMA hurdle surrounding $77.00 guards the quote’s immediate recovery, a break of which could quickly propel the WTI towards the upper line of the stated triangle, near $78.20.

Should the WTI buyers manage to keep the reins past $78.20, the same will confirm the bullish chart pattern and suggest further advances of the quote towards the theoretical target surrounding $101.00.

During the run-up, the previous monthly peak of $92.90 and the August month high near $97.30 can act as buffers.

WTI: Daily chart

Trend: Limited downside expected

Additional important levels

Overview
Today last price75.97
Today Daily Change-0.25
Today Daily Change %-0.33%
Today daily open76.22
 
Trends
Daily SMA2077.05
Daily SMA5082.84
Daily SMA10085.18
Daily SMA20095.19
 
Levels
Previous Daily High77.83
Previous Daily Low75.44
Previous Weekly High82.74
Previous Weekly Low70.27
Previous Monthly High92.92
Previous Monthly Low73.66
Daily Fibonacci 38.2%76.35
Daily Fibonacci 61.8%76.91
Daily Pivot Point S175.16
Daily Pivot Point S274.1
Daily Pivot Point S372.77
Daily Pivot Point R177.55
Daily Pivot Point R278.89
Daily Pivot Point R379.94

Author

Anil Panchal

Anil Panchal

FXStreet

Anil Panchal has nearly 15 years of experience in tracking financial markets. With a keen interest in macroeconomics, Anil aptly tracks global news/updates and stays well-informed about the global financial moves and their implications.

More from Anil Panchal
Share:

Editor's Picks

EUR/USD consolidates around 1.0900, bullish bias remains ahead of key US data

The EUR/USD pair is seen consolidating its strong gains registered over the past two days and oscillating in a narrow band during the Asian session on Tuesday. Spot prices currently trade around the 1.1900 mark, just below an over one-week high touched the previous day.

GBP/USD tilts bullish as markets barrel toward mid-week NFP print

GBP/USD is holding a broader bullish structure on the daily chart, with price trading well above the 50 Exponential Moving Average at 1.3507 and the 200 EMA at 1.3310, confirming the intermediate uptrend that has been in place since the November 2025 low near 1.2300. 

Gold: Will US Retail Sales data propel it above $5,100?

Gold hovers below weekly highs of $5,087 early Tuesday, await US Retail Sales data. The US Dollar enters a downside consolidation phase amid persistent Japanese Yen strength and worsening labor market. Gold settled Monday above $5,000, now looks to take out $5,100 amid bullish daily RSI.

Top Crypto Gainers: World Liberty Financial, MemeCore and Quant gain momentum

World Liberty Financial, MemeCore, and Quant are leading gains over the last 24 hours as the broader cryptocurrency market stabilizes after last week’s correction. Still, the technical outlook for altcoins remains mixed due to prevailing downside pressure and vulnerable market sentiment. 

Follow the money, what USD/JPY in Tokyo is really telling you

Over the past two Tokyo sessions, this has not been a rate story. Not even close. Interest rate differentials have been spectators, not drivers. What has moved USD/JPY in local hours has been flow and flow alone.

Ripple exposed to volatility amid low retail interest, modest fund inflows

Ripple (XRP) is extending its intraday decline to around $1.40 at the time of writing on Monday amid growing pressure from the retail market and risk-off sentiment that continues to keep investors on the sidelines.