WTI Price Analysis: Buyers lurk around 100-day EMA


  • WTI bounces off $39.83, the lowest in one week, to battle 50% Fibonacci retracement.
  • EIA inventories recovered from -3.818M prior, -1.021M forecast.
  • 61.8% Fibonacci retracement, 200-day EMA stand tall to challenge the oil bulls.

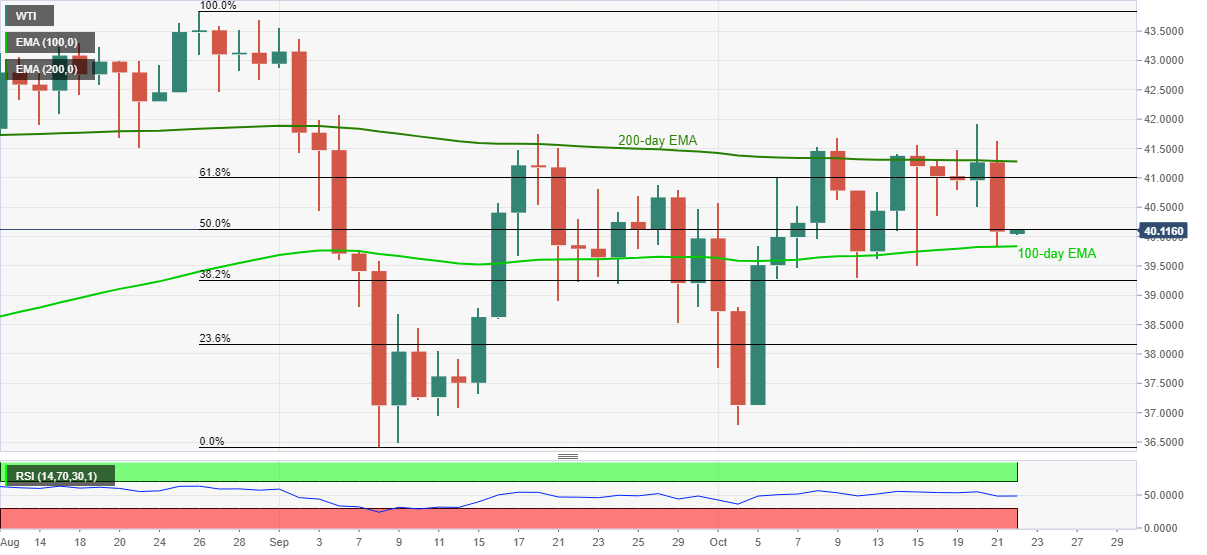
WTI retraces the biggest losses in three weeks while taking rounds to $40.10 during early Thursday morning in Asia. The energy benchmark dropped the lowest since October 15 the previous day before taking a U-turn from 100-day EMA.

While following its repeated pattern to reverse from 100-day EMA, established since early October, the black gold confronts 50% Fibonacci retracement of its August 27 to September 08 downside.

Considering the normal RSI conditions and the oil prices’ usual pullback from the key EMA, WTI buyers can overcome the immediate upside barrier near $40.15 to challenge the late-September high of $40.88.

However, any more upside beyond $40.88 will have to cross the 61.8% Fibonacci retracement level of $41.00 and 200-day EMA, currently around $41.30, to convince the WTI bulls.

Meanwhile, a daily closing below the 100-day EMA level of $39.83 will have the scope to return from 38.2% Fibonacci retracement level near $39.25, failing to which can direct bears to $38.70 and the monthly low around $36.80.

WTI daily chart

Trend: Pullback expected

Additional important levels

Overview
Today last price 40.14
Today Daily Change -1.12
Today Daily Change % -2.71%
Today daily open 41.26
 
Trends
Daily SMA20 40.19
Daily SMA50 40.77
Daily SMA100 40.4
Daily SMA200 38.66
 
Levels
Previous Daily High 41.93
Previous Daily Low 40.51
Previous Weekly High 41.56
Previous Weekly Low 39.31
Previous Monthly High 43.56
Previous Monthly Low 36.43
Daily Fibonacci 38.2% 41.38
Daily Fibonacci 61.8% 41.05
Daily Pivot Point S1 40.54
Daily Pivot Point S2 39.81
Daily Pivot Point S3 39.12
Daily Pivot Point R1 41.96
Daily Pivot Point R2 42.65
Daily Pivot Point R3 43.38


Share: Feed news

Information on these pages contains forward-looking statements that involve risks and uncertainties. Markets and instruments profiled on this page are for informational purposes only and should not in any way come across as a recommendation to buy or sell in these assets. You should do your own thorough research before making any investment decisions. FXStreet does not in any way guarantee that this information is free from mistakes, errors, or material misstatements. It also does not guarantee that this information is of a timely nature. Investing in Open Markets involves a great deal of risk, including the loss of all or a portion of your investment, as well as emotional distress. All risks, losses and costs associated with investing, including total loss of principal, are your responsibility. The views and opinions expressed in this article are those of the authors and do not necessarily reflect the official policy or position of FXStreet nor its advertisers. The author will not be held responsible for information that is found at the end of links posted on this page.

If not otherwise explicitly mentioned in the body of the article, at the time of writing, the author has no position in any stock mentioned in this article and no business relationship with any company mentioned. The author has not received compensation for writing this article, other than from FXStreet.

FXStreet and the author do not provide personalized recommendations. The author makes no representations as to the accuracy, completeness, or suitability of this information. FXStreet and the author will not be liable for any errors, omissions or any losses, injuries or damages arising from this information and its display or use. Errors and omissions excepted.

The author and FXStreet are not registered investment advisors and nothing in this article is intended to be investment advice.

Recommended content


Recommended content

Editors’ Picks

AUD/USD hovers around 0.6500 amid light trading, ahead of US GDP

AUD/USD hovers around 0.6500 amid light trading, ahead of US GDP

AUD/USD is trading close to 0.6500 in Asian trading on Thursday, lacking a clear directional impetus amid an Anzac Day holiday in Australia. Meanwhile, traders stay cautious due ti risk-aversion and ahead of the key US Q1 GDP release. 

AUD/USD News

USD/JPY finds its highest bids since 1990, near 155.50

USD/JPY finds its highest bids since 1990, near 155.50

USD/JPY keeps breaking into its highest chart territory since June of 1990 early Thursday, testing 155.50 for the first time in 34 years as the Japanese Yen remains vulnerable, despite looming Japanese intervention risks. Focus shifts to Thursday's US GDP report and the BoJ decision on Friday. 

USD/JPY News

Gold price treads water near $2,320, awaits US GDP data

Gold price treads water near $2,320, awaits US GDP data

Gold price recovers losses but keeps its range near $2,320 early Thursday. Renewed weakness in the US Dollar and the US Treasury yields allow Gold buyers to breathe a sigh of relief. Gold price stays vulnerable amid Middle East de-escalation, awaiting US Q1 GDP data. 

Gold News

Injective price weakness persists despite over 5.9 million INJ tokens burned

Injective price weakness persists despite over 5.9 million INJ tokens burned

Injective price is trading with a bearish bias, stuck in the lower section of the market range. The bearish outlook abounds despite the network's deflationary efforts to pump the price. Coupled with broader market gloom, INJ token’s doomed days may not be over yet.

Read more

Meta Platforms Earnings: META sinks 10% on lower Q2 revenue guidance Premium

Meta Platforms Earnings: META sinks 10% on lower Q2 revenue guidance

This must be "opposites" week. While Doppelganger Tesla rode horrible misses on Tuesday to a double-digit rally, Meta Platforms produced impressive beats above Wall Street consensus after the close on Wednesday, only to watch the share price collapse by nearly 10%.

Read more

Forex MAJORS

Cryptocurrencies

Signatures