|

WTI Price Analysis: Bulls catch a breather after refreshing 13-month high near $62.00

  • WTI eases from multi-month high but stays inside a short-term bullish chart pattern.
  • Monthly support line adds to the downside filters, channel’s resistance can probe bulls.

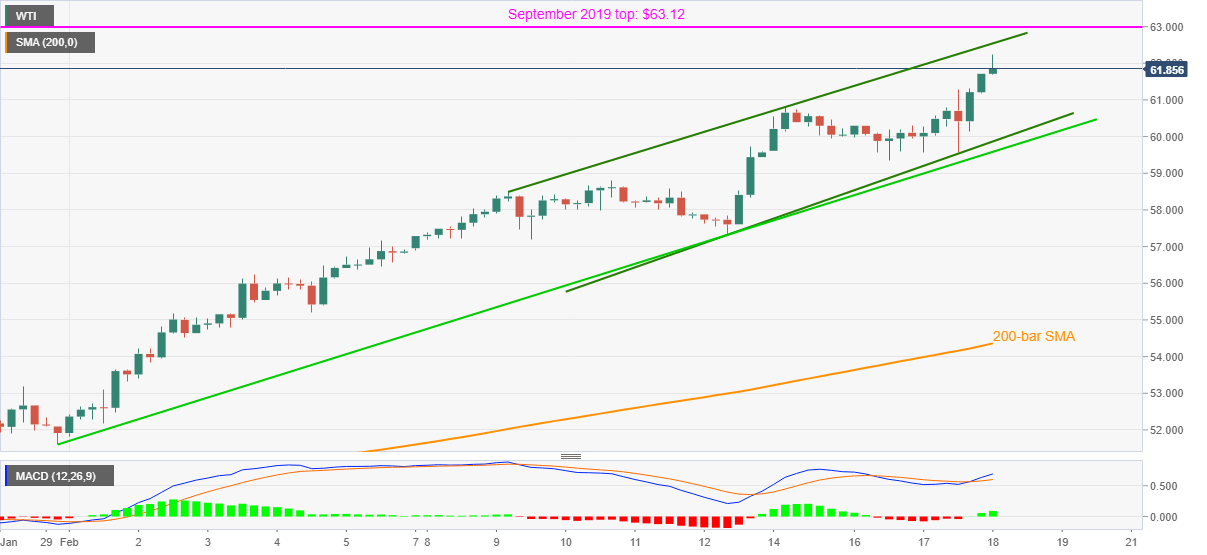
Following its run-up to the fresh high since January 2020, WTI eases from $62.25 to currently around $61.85 during the early Thursday’s trading. Even so, the energy benchmark stays within a one-week-old rising trend channel.

With the MACD signal staying green, WTI has a bit more gap above $62.00 before it hits the channel’s resistance line near $62.55.

If at all the oil buyers manage to cross $62.55, September 2019 peak surrounding $63.12 will off an intermediate halt before propelling the quote to the previous year’s high of $65.45.

Meanwhile, an ascending trend line from January 31, at $59.60, adds to the downside filters even if the quote’s pullback moves, if any, break the stated channel’s support near $59.90.

It should, however, be noted that the black gold’s weakness below $59.90 will not hesitate to test the 200-bar SMA level of $54.35.

WTI four-hour chart

Trend: Bullish

Additional important levels

Overview
Today last price61.83
Today Daily Change0.60
Today Daily Change %0.98%
Today daily open61.23
 
Trends
Daily SMA2055.9
Daily SMA5052.13
Daily SMA10046.73
Daily SMA20043.08
 
Levels
Previous Daily High61.31
Previous Daily Low59.57
Previous Weekly High59.73
Previous Weekly Low56.89
Previous Monthly High53.94
Previous Monthly Low47.26
Daily Fibonacci 38.2%60.64
Daily Fibonacci 61.8%60.23
Daily Pivot Point S160.1
Daily Pivot Point S258.96
Daily Pivot Point S358.36
Daily Pivot Point R161.83
Daily Pivot Point R262.44
Daily Pivot Point R363.57

Author

Anil Panchal

Anil Panchal

FXStreet

Anil Panchal has nearly 15 years of experience in tracking financial markets. With a keen interest in macroeconomics, Anil aptly tracks global news/updates and stays well-informed about the global financial moves and their implications.

More from Anil Panchal
Share:

Markets move fast. We move first.

Orange Juice Newsletter brings you expert driven insights - not headlines. Every day on your inbox.

By subscribing you agree to our Terms and conditions.

Editor's Picks

EUR/USD holds around 1.1750 after weak German and EU PMI data

EUR/USD maintains its range trade at around 1.1750 in European trading on Tuesday. Weaker-than-expected December PMI data from Germany and the Eurozone make it difficult for the Euro to find demand, while investors refrain from taking large USD positions ahead of key employment data.

GBP/USD climbs above 1.3400 after upbeat UK PMI data

GBP/USD gains traction and trades in positive territory above 1.3400 on Tuesday as the British Pound benefits from upbeat PMI data. Later in the day, crucial data releases from the US, including Nonfarm Payrolls, Retail Sales and PMI, could trigger the next big action in the pair.

Gold retreats from seven week highs on profit-taking; all eyes on US NFP release

Gold price loses momentum below $4,300 during the early European trading hours on Tuesday, pressured by some profit-taking and weak long liquidation from the shorter-term futures traders. Furthermore, optimism around Ukraine peace talks could weigh on the safe-haven asset like Gold.

US Nonfarm Payrolls expected to point to cooling labor market in November

The United States Bureau of Labor Statistics will release the delayed Nonfarm Payrolls (NFP) data for October and November on Tuesday at 13:30 GMT. Economists expect Nonfarm Payrolls to rise by 40,000 in November. The Unemployment Rate is likely to remain unchanged at 4.4% during the same period.

NFP preview: Complex data release will determine if Fed was right to cut rates

The long wait is over, and the Bureau of Labor Statistics in the US will release nonfarm payrolls reports for both November and October at 1330 GMT on Tuesday. The overall NFP figure for October is expected to be -10k, however, it is expected to be influenced by a massive 130k drop in federal department workers. 

BNB Price Forecast: BNB slips below $855 as bearish on-chain signals and momentum indicators turn negative

BNB, formerly known as Binance Coin, continues to trade down around $855 at the time of writing on Tuesday, after a slight decline the previous day. Bearish sentiment further strengthens as BNB’s on-chain and derivatives data show rising retail activity.