|

WTI Price Analysis: Bulls approach $70.85 hurdle during four-day winning streak

  • WTI grinds near one-week high marked the previous day, up for the fourth consecutive day.
  • Successful break of 50-SMA joins upbeat oscillators to underpin bullish bias.
  • Fortnight-long descending resistance line guards immediate upside ahead of a horizontal resistance area established since early February.
  • One-week-old horizontal support acts as an additional downside filter.

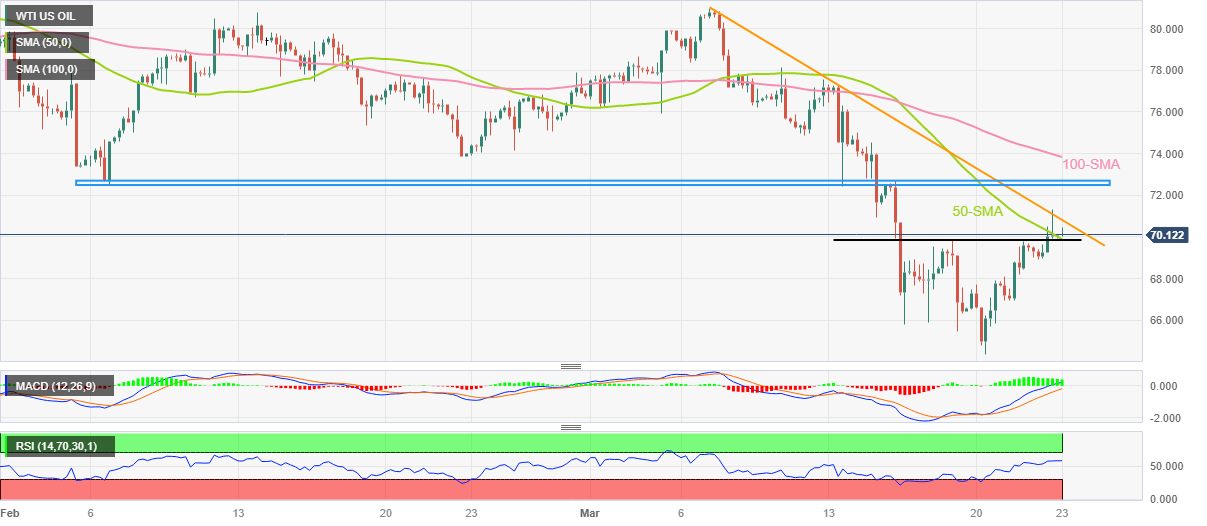
WTI crude oil buyers keep the reins for the fourth consecutive day as the quote rises to $70.25 during early Thursday. In doing so, the black gold prices seesaw around the one-week top marked the previous day while approaching the key descending resistance line stretched from March 07.

The energy benchmark’s latest upside could be linked to a sustained break of a one-week-old horizontal resistance, now support, as well as the 50-SMA. Adding strength to the upside bias could be the bullish MACD signals and upbeat RSI (14) line, not overbought.

With this, the WTI bulls appear all-set to cross the aforementioned resistance line, around $70.85 by the press time. However, the seven-week-old horizontal region surrounding $72.50-70 appears a tough nut to crack for Oil buyers.

In a case where the commodity price rally beyond $72.70, the late February low joins the 100-SMA to highlight $73.85 as the last defense of the bears.

On the contrary, the 50-SMA and one-week-old horizontal support, previous resistance, restrict the short-term downside of the black gold near $69.85.

Following that, $68.00 and $66.50 may prod WTI bears before directing them to the monthly of around $64.40, also the lowest levels since December 2021.

WTI: Four-hour chart

Trend: Further upside expected

Additional important levels

Overview
Today last price70.16
Today Daily Change0.23
Today Daily Change %0.33%
Today daily open69.93
 
Trends
Daily SMA2074.24
Daily SMA5076.83
Daily SMA10078.04
Daily SMA20084.87
 
Levels
Previous Daily High71.33
Previous Daily Low68.92
Previous Weekly High77.55
Previous Weekly Low65.44
Previous Monthly High80.75
Previous Monthly Low72.5
Daily Fibonacci 38.2%70.41
Daily Fibonacci 61.8%69.84
Daily Pivot Point S168.79
Daily Pivot Point S267.65
Daily Pivot Point S366.38
Daily Pivot Point R171.2
Daily Pivot Point R272.47
Daily Pivot Point R373.61

Author

Anil Panchal

Anil Panchal

FXStreet

Anil Panchal has nearly 15 years of experience in tracking financial markets. With a keen interest in macroeconomics, Anil aptly tracks global news/updates and stays well-informed about the global financial moves and their implications.

More from Anil Panchal
Share:

Markets move fast. We move first.

Orange Juice Newsletter brings you expert driven insights - not headlines. Every day on your inbox.

By subscribing you agree to our Terms and conditions.

Editor's Picks

EUR/USD recovers to 1.1750 region as 2025 draws to a close

Following the bearish action seen in the European session on Wednesday, EUR/USD regains its traction and recovery to the 1.1750 region. Nevertheless, the pair's volatility remains low as trading conditions thin out on the last day of the year.

GBP/USD stays weak near 1.3450 on modest USD recovery

GBP/USD remains under modest beairsh pressure and fluctuates at around 1.3450 on Wednesday. The US Dollar finds fresh demand due to the end-of-the-year position adjustments, weighing on the pair amid the pre-New Year trading lull. 

Gold retreats to $4,300 area, looks to post monthly gains

Gold stays on the back foot on the last day of 2025 and trades near $4,300, possibly pressured by profit-taking and position adjustments. Nevertheless, XAU/USD remains on track to post gains for December and extend its winning streak into a fifth consecutive month.

Bitcoin, Ethereum and XRP prepare for a potential New Year rebound

Bitcoin, Ethereum, and Ripple are holding steady on Wednesday after recording minor gains on the previous day. Technically, Bitcoin could extend gains within a triangle pattern while Ethereum and Ripple face critical overhead resistance. 

Economic outlook 2026-2027 in advanced countries: Solidity test

After a year marked by global economic resilience and ending on a note of optimism, 2026 looks promising and could be a year of solid economic performance. In our baseline scenario, we expect most of the supportive factors at work in 2025 to continue to play a role in 2026.

Crypto market outlook for 2026

Year 2025 was volatile, as crypto often is.  Among positive catalysts were favourable regulatory changes in the U.S., rise of Digital Asset Treasuries (DAT), adoption of AI and tokenization of Real-World-Assets (RWA).