|

WTI Price Analysis: Bounces off $84.50 key support

  • WTI pares the biggest daily loss in seven weeks, prints mild gains of late.
  • Convergence of 50% Fibonacci retracement level, monthly support line restricts immediate downside.
  • Bearish MACD signals and sustained trading below 200-SMA favor sellers.
  • Buyers need validation from $88.10 to retake control.

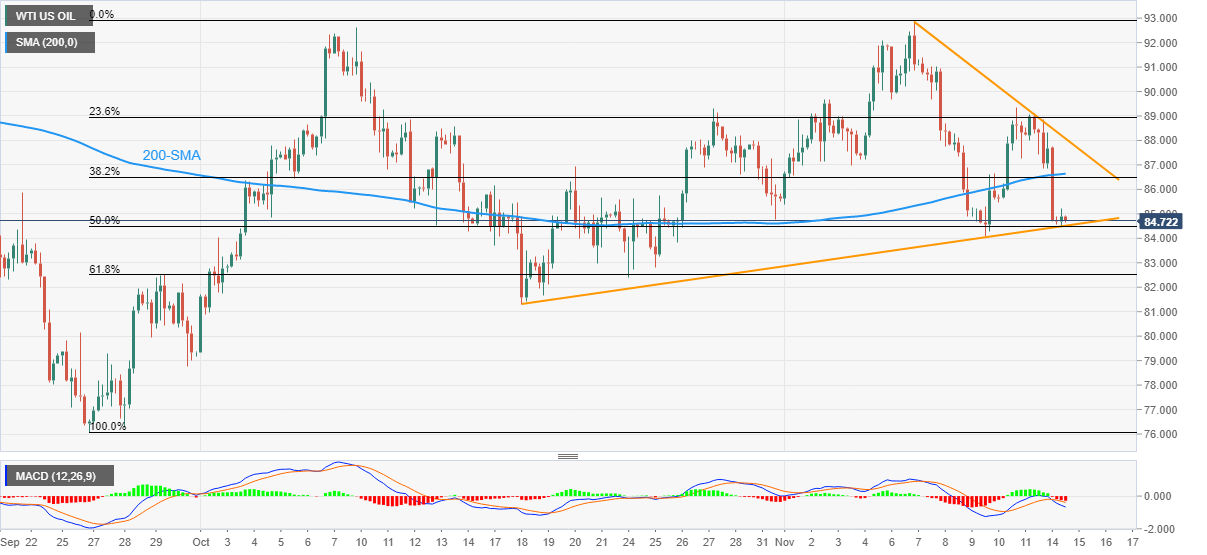
WTI crude oil remains pressured around $84.70 while consolidating the previous day’s losses, the biggest in nearly two months, heading into Tuesday’s European session.

In doing so, the black gold pokes the $84.50 support confluence comprising the one-month-old ascending trend line and the 50% Fibonacci retracement level of the commodity’s September-November moves.

That said, the quote’s sustained trading below the 200-SMA and bearish MACD signals keep WTI bears hopeful of breaking the $84.50 support.

Following that, a slump toward the 61.8% Fibonacci retracement level of $82.50 appears imminent. However, October 18 swing low near $81.30 and the $80.00 psychological magnet could challenge the oil sellers afterward.

Meanwhile, recovery moves need to cross the 200-SMA hurdle of $86.65 to convince short-term buyers.

Even so, a downward-sloping resistance line from November 07, close to $88.10, holds the key to oil buyer’s entry.

If the commodity buyers stay dominant past $88.10, the $90.00 round figure and the monthly high near $93.00 should flash on their radars.

Overall, the energy benchmark’s latest inaction fails to push back the sellers targeting the late October’s low.

WTI: Four-hour chart

Trend: Further downside expected

Additional important levels

Overview
Today last price84.8
Today Daily Change0.21
Today Daily Change %0.25%
Today daily open84.59
 
Trends
Daily SMA2086.77
Daily SMA5085.46
Daily SMA10090.09
Daily SMA20097.41
 
Levels
Previous Daily High89.11
Previous Daily Low84.58
Previous Weekly High92.92
Previous Weekly Low84.06
Previous Monthly High92.63
Previous Monthly Low79.32
Daily Fibonacci 38.2%86.31
Daily Fibonacci 61.8%87.38
Daily Pivot Point S183.07
Daily Pivot Point S281.56
Daily Pivot Point S378.54
Daily Pivot Point R187.61
Daily Pivot Point R290.63
Daily Pivot Point R392.14

Author

Anil Panchal

Anil Panchal

FXStreet

Anil Panchal has nearly 15 years of experience in tracking financial markets. With a keen interest in macroeconomics, Anil aptly tracks global news/updates and stays well-informed about the global financial moves and their implications.

More from Anil Panchal
Share:

Editor's Picks

EUR/USD holds steady above 1.1850 in quiet session

EUR/USD stays defensive but holds 1.1850 amid quiet markets in the European hours on Monday.  The US Dollar is struggling for direction due to thin liquidity conditions as US markets are closed in observance of Presidents' Day holiday. 

GBP/USD flat lines near 1.3650 ahead of UK and US data

GBP/USD kicks off a new week on a subdued note and oscillates in a narrow range near 1.3650 on Monday. The mixed fundamental backdrop warrants some caution for aggressive traders as the market focus now shifts to this week's important data releases from the UK and the US.

Gold corrects lower, tries to stabilize above $5,000

Gold started the week under bearish pressure and declined to the $4,960 area before staging a modest rebound. As trading volumes remain thin with the US financial markets remaining closed on Presidents' Day holiday, XAU/USD looks to stabilize above $5,000 ahead of this week's key data releases.

Bitcoin consolidates as on-chain data show mixed signals

Bitcoin price has consolidated between $65,700 and $72,000 over the past nine days, with no clear directional bias. US-listed spot ETFs recorded a $359.91 million weekly outflow, marking the fourth consecutive week of withdrawals.

The week ahead: Key inflation readings and why the AI trade could be overdone

It is likely to be a quiet start to the week, with US markets closed on Monday for Presidents Day. European markets are higher across the board and gold is clinging to the $5,000 level after the tamer than expected CPI report in the US reduced haven flows to precious metals.

Monero Price Forecast: XMR risks a drop below $300 under mounting bearish pressure

Monero (XMR) starts the week under pressure, recording a 4% decline at press time on Monday after a 7% drop the previous day, putting the $300 support zone in focus.