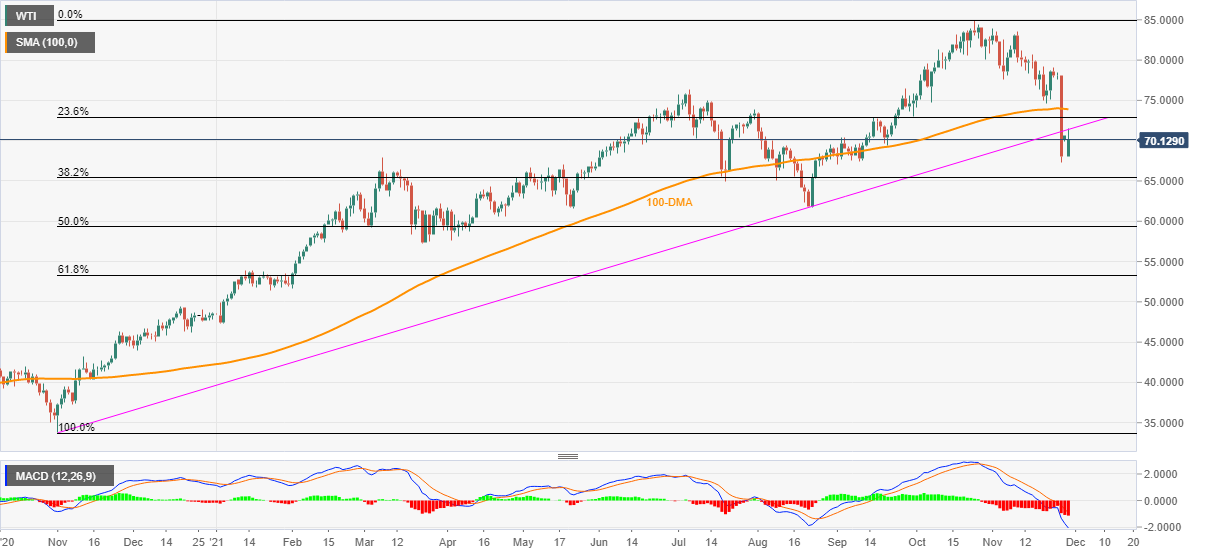
WTI Price Analysis: Bears remain hopeful around $70.00
- WTI consolidates Friday’s heavy losses around September’s low.
- Previous support from November 2020 challenges corrective pullback, bearish MACD signals also favor sellers.
- March’s top offer immediate support, 100-DMA adds to the upside filters.

WTI licks Friday’s wounds of 13% slump while defending the $70.00 threshold during Monday’s initial Asian session.
Even so, the black gold keeps the previous day’s downside break of the yearly support line, now resistance, while keeping the sellers on the driver’s seat. Adding to the bearish bias is the MACD line that stays deep down inside the red territory.
That said, March month’s high of around $67.85 offers immediate support to the commodity prices ahead of 38.2% Fibonacci retracement (Fibo.) of November 2020 to October 2021 upside, close to $65.40.
It should be noted, however, that September’s swing low near $61.80 becomes a tough nut to crack for WTI bears.
On the contrary, a daily closing beyond the stated support-turned-resistance around $71.35 needs validation from the 100-DMA level of $73.90 and the $74.00 threshold to recall the buyers.
Following that, November 22 low near $74.65 and July’s top of $76.40 will act as additional resistance for the bulls to cross.
WTI: Daily chart
Trend: Further weakness expected
Author

Anil Panchal
FXStreet
Anil Panchal has nearly 15 years of experience in tracking financial markets. With a keen interest in macroeconomics, Anil aptly tracks global news/updates and stays well-informed about the global financial moves and their implications.


