WTI Price Analysis: Awaits acceptance above 21-DMA on the road to recovery


  • WTI price is resuming the uptrend after correcting sharply on Tuesday.
  • Weaker US dollar, lower inventories offer support to the US oil.
  • Acceptance above 21-DMA at $103.24 is critical for resuming the uptrend.

WTI (NYMEX futures) is looking to extend the rebound above the $103 mark, having found strong bids below the $102 region.

The renewed upside in the US oil comes after the black gold tumbled roughly 5% on global growth concerns, which stoked fears over the demand for oil and its product. The International Monetary Fund (IMF) cut the 2022 global growth forecast by nearly 1 percentage point on Tuesday.

Investors seem to have looked past the IMF forecasts, as a 4.5 million barrels drawdown in the US API weekly crude stockpiles, Libyan fuel outage and lower OPEC+ output flare-up supply-side concerns and offer the much-needed support to the price of WTI.

Further, oil price also finds support from the gradual reopening of Shanghai city from the covid lockdown. Meanwhile, a broad-based retreat in the US dollar also remains one of the key reasons behind the rebound in the USD-sensitive oil.

From a near-term technical perspective, WTI’s corrective pullback saw the price close below the flattish 21-Daily Moving Average (DMA) at $103.24 for the first time this week.

With the 14-day Relative Strength Index (RSI), however, still holding above the midline, buyers remain hopeful for a meaningful recovery.

Therefore, daily closing above the latter is needed to trigger a sustained move higher towards the previous day’s high of $108.23. Ahead of that, the $105 round number will emerge as a tough nut to crack for bulls.

WTI: Daily chart


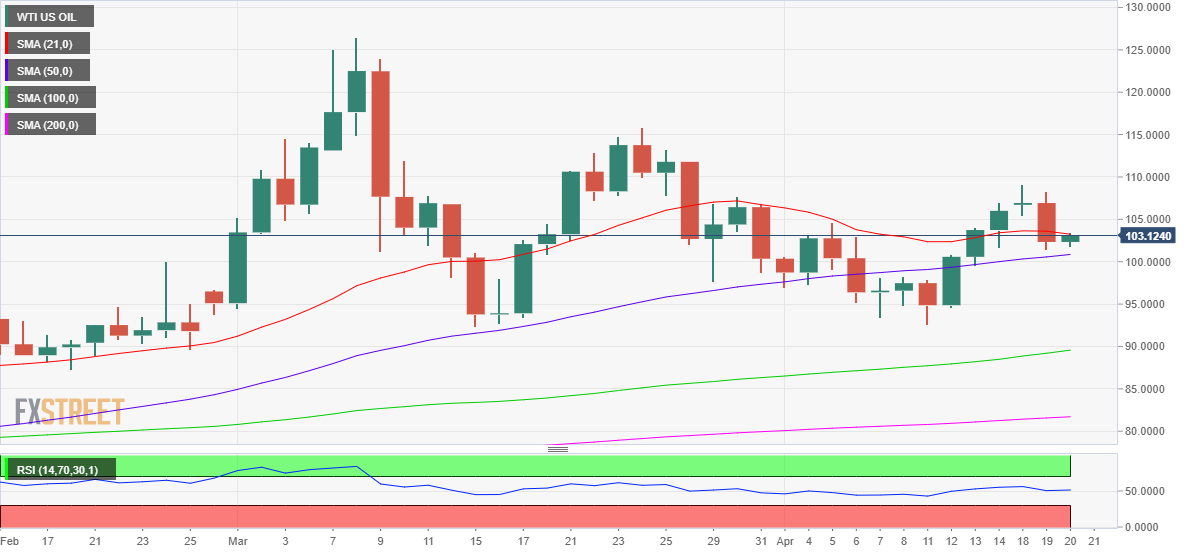
On the other side, if bulls fail to find a foothold above the 21-DMA, then a test of the 50-DMA support at $100.85 will be inevitable.

The next significant downside target will be then envisioned at the $100.00 psychological level.   

WTI: Additional levels to watch

WTI US OIL

Overview
Today last price 102.98
Today Daily Change 0.62
Today Daily Change % 0.61
Today daily open 102.33
 
Trends
Daily SMA20 103.25
Daily SMA50 100.57
Daily SMA100 89.2
Daily SMA200 81.57
 
Levels
Previous Daily High 108.24
Previous Daily Low 101.44
Previous Weekly High 107
Previous Weekly Low 92.65
Previous Monthly High 126.51
Previous Monthly Low 92.37
Daily Fibonacci 38.2% 104.04
Daily Fibonacci 61.8% 105.64
Daily Pivot Point S1 99.77
Daily Pivot Point S2 97.21
Daily Pivot Point S3 92.98
Daily Pivot Point R1 106.57
Daily Pivot Point R2 110.8
Daily Pivot Point R3 113.36


Share: Feed news

Information on these pages contains forward-looking statements that involve risks and uncertainties. Markets and instruments profiled on this page are for informational purposes only and should not in any way come across as a recommendation to buy or sell in these assets. You should do your own thorough research before making any investment decisions. FXStreet does not in any way guarantee that this information is free from mistakes, errors, or material misstatements. It also does not guarantee that this information is of a timely nature. Investing in Open Markets involves a great deal of risk, including the loss of all or a portion of your investment, as well as emotional distress. All risks, losses and costs associated with investing, including total loss of principal, are your responsibility. The views and opinions expressed in this article are those of the authors and do not necessarily reflect the official policy or position of FXStreet nor its advertisers. The author will not be held responsible for information that is found at the end of links posted on this page.

If not otherwise explicitly mentioned in the body of the article, at the time of writing, the author has no position in any stock mentioned in this article and no business relationship with any company mentioned. The author has not received compensation for writing this article, other than from FXStreet.

FXStreet and the author do not provide personalized recommendations. The author makes no representations as to the accuracy, completeness, or suitability of this information. FXStreet and the author will not be liable for any errors, omissions or any losses, injuries or damages arising from this information and its display or use. Errors and omissions excepted.

The author and FXStreet are not registered investment advisors and nothing in this article is intended to be investment advice.

Recommended content


Recommended content

Editors’ Picks

AUD/USD jumps above 0.6500 after hot Australian CPI data

AUD/USD jumps above 0.6500 after hot Australian CPI data

AUD/USD extended gains and recaptured 0.6500 in Asian trading, following the release of hotter-than-expected Australian inflation data. The Australian CPI rose 1% in QoQ in Q1 against 0.8% forecast, providing extra legs to the Australian Dollar upside. 

AUD/USD News

EUR/USD holds above 1.0700 on weaker US Dollar, upbeat Eurozone PMI

EUR/USD holds above 1.0700 on weaker US Dollar, upbeat Eurozone PMI

EUR/USD holds above the 1.0700 psychological barrier during the early Asian session on Wednesday. The weaker-than-expected US PMI data for April drags the Greenback lower and creates a tailwind for the pair. 

EUR/USD News

Gold price cautious despite weaker US Dollar and falling US yields

Gold price cautious despite weaker US Dollar and falling US yields

Gold retreats modestly after failing to sustain gains despite fall in US Treasury yields, weaker US Dollar. XAU/USD struggles to capitalize following release of weaker-than-expected S&P Global PMIs, fueling speculation about potential Fed rate cuts.

Gold News

Ethereum ETF issuers not giving up fight, expert says as Grayscale files S3 prospectus

Ethereum ETF issuers not giving up fight, expert says as Grayscale files S3 prospectus

Ethereum exchange-traded funds theme gained steam after the landmark approval of multiple BTC ETFs in January. However, the campaign for approval of this investment alternative continues, with evidence of ongoing back and forth between prospective issuers and the US SEC.

Read more

US versus the Eurozone: Inflation divergence causes monetary desynchronization

US versus the Eurozone: Inflation divergence causes monetary desynchronization

Historically there is a very close correlation between changes in US Treasury yields and German Bund yields. This is relevant at the current juncture, considering that the recent hawkish twist in the tone of the Fed might continue to push US long-term interest rates higher and put upward pressure on bond yields in the Eurozone.

Read more

Forex MAJORS

Cryptocurrencies

Signatures