WTI Price Analysis: 50-SMA on 4H guards the downside, API eyed


  • WTI price is reversing a dip to 108.00 amid risk-aversion.
  • Sustaining above the 50-SMA on the 4H chart is critical for oil bulls.
  • RSI defends the midline, backs the bulls ahead of the API data.

WTI (NYMEX futures) is attempting a bounce back above the $109.00 mark, having found strong bids just above $108.00 in the last hours.

The rebound in the US oil comes even though risk sentiment remains sour amid a revival of the global growth fears, in the wake of disappointing Euro area and UK Manufacturing and Services PMIs reports for May.

The renewed selling seen in the US dollar could be aiding the latest uptick in the black gold while markets stay hopeful of yet another drawdown in the American crude stockpiles data. The American Petroleum Institute (API) will release its weekly crude stocks change report towards the NY close at 2030 GMT.

From a short-term technical perspective, the ascending 50-Simple Moving Average (DMA) on the four-hour chart at $108.88 has come to the rescue of bulls, as they have managed to regain control above the latter.

WTI traders are now eyeing a sustained move above the horizontal 21-SMA at $109.10 to cement the recovery momentum.

Acceptance above that level will power bulls to retest the $110.00 threshold. Further up, the previous day’s high of $111 25 could be challenged by the bullish traders,

The 14-day Relative Strength Index (RSI) is inching higher just above the midline, suggesting that recovery could have legs going forward.

WTI: Four-hour chart

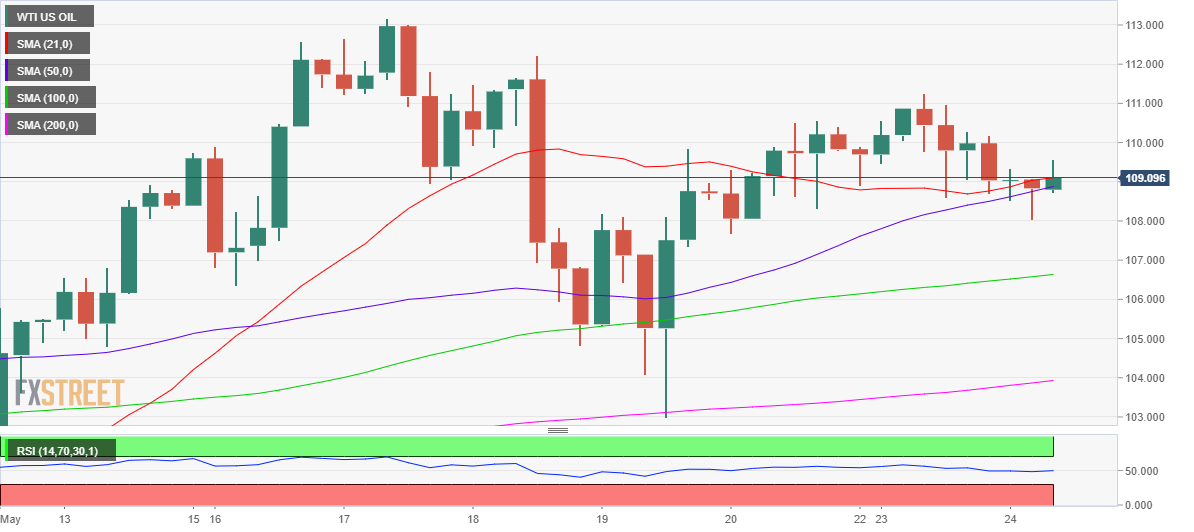
On the other side, a four-hourly candlestick closing below the 50-SMA will revive the bearish interests. WTI will then resume its corrective downside towards the daily lows of $108.04 once again.

The next significant downside target is aligned at the upward-sloping 200-SMA at $106.63.   

WTI: Additional levels to watch

WTI US OIL

Overview
Today last price 109.07
Today Daily Change -1.01
Today Daily Change % -0.92
Today daily open 110.06
 
Trends
Daily SMA20 105.84
Daily SMA50 103.84
Daily SMA100 97.28
Daily SMA200 85.76
 
Levels
Previous Daily High 111.25
Previous Daily Low 108.6
Previous Weekly High 113.18
Previous Weekly Low 102.99
Previous Monthly High 109.13
Previous Monthly Low 92.65
Daily Fibonacci 38.2% 110.24
Daily Fibonacci 61.8% 109.61
Daily Pivot Point S1 108.69
Daily Pivot Point S2 107.32
Daily Pivot Point S3 106.03
Daily Pivot Point R1 111.34
Daily Pivot Point R2 112.62
Daily Pivot Point R3 113.99


Share: Feed news

Information on these pages contains forward-looking statements that involve risks and uncertainties. Markets and instruments profiled on this page are for informational purposes only and should not in any way come across as a recommendation to buy or sell in these assets. You should do your own thorough research before making any investment decisions. FXStreet does not in any way guarantee that this information is free from mistakes, errors, or material misstatements. It also does not guarantee that this information is of a timely nature. Investing in Open Markets involves a great deal of risk, including the loss of all or a portion of your investment, as well as emotional distress. All risks, losses and costs associated with investing, including total loss of principal, are your responsibility. The views and opinions expressed in this article are those of the authors and do not necessarily reflect the official policy or position of FXStreet nor its advertisers. The author will not be held responsible for information that is found at the end of links posted on this page.

If not otherwise explicitly mentioned in the body of the article, at the time of writing, the author has no position in any stock mentioned in this article and no business relationship with any company mentioned. The author has not received compensation for writing this article, other than from FXStreet.

FXStreet and the author do not provide personalized recommendations. The author makes no representations as to the accuracy, completeness, or suitability of this information. FXStreet and the author will not be liable for any errors, omissions or any losses, injuries or damages arising from this information and its display or use. Errors and omissions excepted.

The author and FXStreet are not registered investment advisors and nothing in this article is intended to be investment advice.

Recommended content


Recommended content

Editors’ Picks

AUD/USD could extend the recovery to 0.6500 and above

AUD/USD could extend the recovery to 0.6500 and above

The enhanced risk appetite and the weakening of the Greenback enabled AUD/USD to build on the promising start to the week and trade closer to the key barrier at 0.6500 the figure ahead of key inflation figures in Australia.

AUD/USD News

EUR/USD now refocuses on the 200-day SMA

EUR/USD now refocuses on the 200-day SMA

EUR/USD extended its positive momentum and rose above the 1.0700 yardstick, driven by the intense PMI-led retracement in the US Dollar as well as a prevailing risk-friendly environment in the FX universe.

EUR/USD News

Gold struggles around $2,325 despite broad US Dollar’s weakness

Gold struggles around $2,325 despite broad US Dollar’s weakness

Gold reversed its direction and rose to the $2,320 area, erasing a large portion of its daily losses in the process. The benchmark 10-year US Treasury bond yield stays in the red below 4.6% following the weak US PMI data and supports XAU/USD.

Gold News

Bitcoin price makes run for previous cycle highs as Morgan Stanley pushes BTC ETF exposure

Bitcoin price makes run for previous cycle highs as Morgan Stanley pushes BTC ETF exposure

Bitcoin (BTC) price strength continues to grow, three days after the fourth halving. Optimism continues to abound in the market as Bitcoiners envision a reclamation of previous cycle highs.

Read more

US versus the Eurozone: Inflation divergence causes monetary desynchronization

US versus the Eurozone: Inflation divergence causes monetary desynchronization

Historically there is a very close correlation between changes in US Treasury yields and German Bund yields. This is relevant at the current juncture, considering that the recent hawkish twist in the tone of the Federal Reserve might continue to push US long-term interest rates higher and put upward pressure on bond yields in the Eurozone. 

Read more

Forex MAJORS

Cryptocurrencies

Signatures