|

WTI Price Analysis: 200-HMA probes bears above $40.00

  • WTI stays pressured beyond $40.00 despite multiple bounces off 200-HMA.
  • MACD conditions suggest bears rolling up their sleeves for entry.
  • Bulls will have multiple upside barriers beyond $41.00.

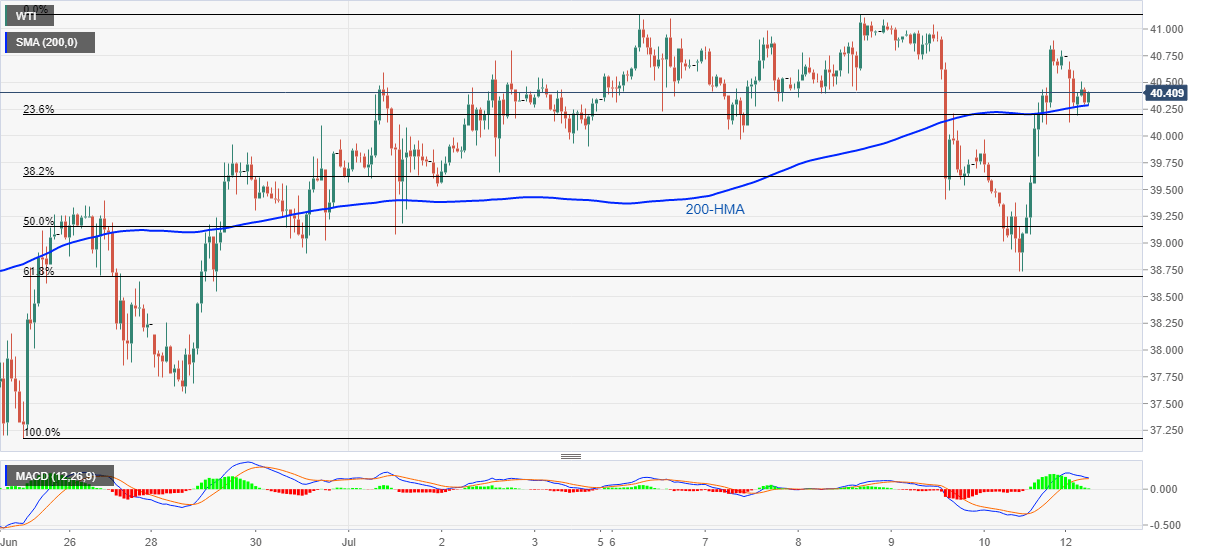
WTI recedes to $40.31, down 1.06% on a day, during the early Monday’s trading. The black gold extends late Friday's pullback from $40.89 but 200-HMA keeps restricting immediate downside.

Even so, repeated failures to stay strong above $40.00 joins the likely turn of MACD histogram in favor of sellers to suggest the energy benchmark’s momentum weakness. As a result, the bears are preparing for entry below 200-HMA level of $40.28 to attack $40.00.

In doing so, 61.8% Fibonacci retracement of its June 25 to July 06 upside, around 38.68, will be on their radars. Though, $39.30 and 50% Fibonacci retracement near $39.15 can offer intermediate halts during the fall.

On the upside, Friday’s top around $41.00 can act as immediate resistance ahead of the monthly peak close to $41.15.

However, the quote’s rise past-$41.00 needs validation from June month’s peak around $41.65 before eyeing February month low near $44.00.

WTI hourly chart

Trend: Pullback expected

Additional important levels

Overview
Today last price40.31
Today Daily Change-0.44
Today Daily Change %-1.08%
Today daily open40.75
 
Trends
Daily SMA2039.54
Daily SMA5035.22
Daily SMA10032.79
Daily SMA20044.58
 
Levels
Previous Daily High40.89
Previous Daily Low38.73
Previous Weekly High41.14
Previous Weekly Low38.73
Previous Monthly High41.65
Previous Monthly Low34.45
Daily Fibonacci 38.2%40.07
Daily Fibonacci 61.8%39.56
Daily Pivot Point S139.35
Daily Pivot Point S237.96
Daily Pivot Point S337.19
Daily Pivot Point R141.52
Daily Pivot Point R242.29
Daily Pivot Point R343.68

Author

Anil Panchal

Anil Panchal

FXStreet

Anil Panchal has nearly 15 years of experience in tracking financial markets. With a keen interest in macroeconomics, Anil aptly tracks global news/updates and stays well-informed about the global financial moves and their implications.

More from Anil Panchal
Share:

Editor's Picks

EUR/USD holds above 1.1750 after mixed EU PMI data

EUR/USD manages to hold above 1.1750 but struggles to gather recovery momentum on Friday, following the mixed February PMI figures from Germany and the Eurozone. In the second half of the day, Q4 GDP, December inflation and February PMI data from the US will be watched closely by market participants.

GBP/USD recovers further toward 1.3500 after UK PMI data

GBP/USD is recovering ground further toward 1.3500 in European trading on Friday, helped by a modest uptick in the Pound Sterling after stronger-than-expected UK January Retail Sales and February PMI data. However, the pair's further upside could be limited amid persistent US Dollar strength as the focus turns to key US data. 

Gold sticks to positive bias above $5,000 ahead of US data

Gold gains some positive traction for the third consecutive day on Friday. holding above $5,000. Traders now look forward to the key US macro releases – the Advance Q4 GDP report and the Personal Consumption Expenditures (PCE) Price Index – for fresh trading impetus. 

US GDP growth expected to slow down significantly in Q4 after stellar Q3 

The United States Bureau of Economic Analysis will publish the first preliminary estimate of the fourth-quarter Gross Domestic Product at 13:30 GMT. Analysts forecast the US economy to have expanded at a 3% annualized rate, slowing down from the 4.4% growth posted in the previous quarter.

Iran tensions and AI fears at the forefront ahead of key US data

Thursday’s scorecard shows major US Stock benchmarks closed modestly in the red amid mounting US-Iran tensions and AI disruption worries. The S&P 500 shed 19 points (0.3%) to 6,861, the Nasdaq 100 lost 101 points (0.4%) to 24,797, and the Dow Jones Industrial Average dropped 267 points (0.5%) to 49,395.

Official Trump price approaches breakout with mixed signals from traders

Official Trump (TRUMP) is trading at $3.50 at the time of writing, approaching its upper consolidation range. A breakout from this range could open the door for an upside move. On-chain data shows market indecision, with balanced flows between bulls and bears, signaling a lack of clear directional bias.