|

WTI gains momentum amid output cuts and fears of global economic slowdown; eyes set on $84.00

  • US crude oil benchmark, WTI, rises for the third consecutive day, trading at $83.48, up by 0.80%.
  • Oil demand is predicted to grow by 2.25 million bpd in 2024, down from 2024’s 2.44 million bpd, according to OPEC+.
  • Weakness in China’s economy could dent oil demand.

Western Texas Intermediate (WTI), the US crude oil benchmark advances for the third day in the week, trims some of its Thursday’s losses, as it tracks an upslope support trendline since mid-July. At the time of writing, WTI is exchanging hands at $83.48, above its opening price by 0.80%.

OPEC+ output reductions and weakening US dollar support crude’s upward trajectory, despite potential demand concerns from China

Oil prices rose on several factors weighing on the market, like Saudi Arabia and Russia’s 1.3 million of crude oil output cuts, while the International Energy Agency (IEA) stated supply cuts by the Organization of Petroleum Exporting Countries and its allies (OPEC+), could drive prices higher before economic headwinds dent global demand growth.

In the meantime, OPEC+ noted that Oil’s demand would increase by 2.25 million bpd in 2024, below this year’s 2.44 million bpd.

Meanwhile, the United States (US) inflation figures on the consumer side witnessed a dip, which weakened the greenback, and underpinned WTI’s towards its new year-to-date (YTD) high above $84.00 per barrel. Nevertheless, Friday’s US PPI data bolstered the US Dollar (USD) as shown by the US Dollar Index (DXY), gaining 0.24% at 102.870, while WTI’s prices drifted lower.

Mixed economic data from China would keep WII’s gains capped on fears the country has been hit by deflation, suggesting the Covid-19 recovery would remain losing steam, weighing on oil demand,

WTI Price Analysis: Technical outlook
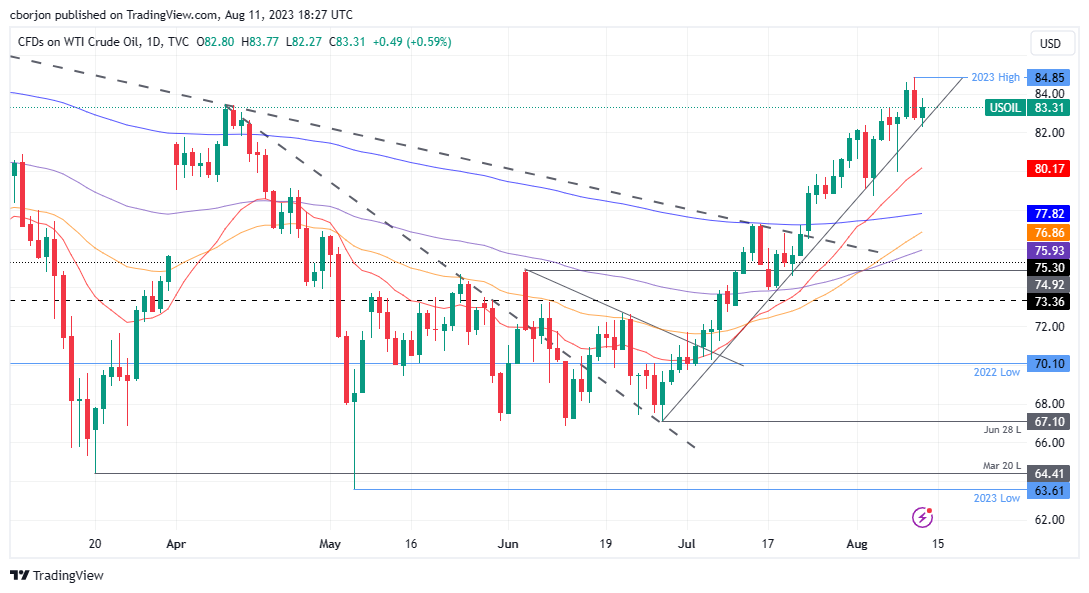
WTI Daily chart

WTI’s daily chart portrays the pair as upward biased, thought at the brisk of a support trendline break, which could see WTI’s diving towards the 20-day Exponential Moving Average (EMA) at $80.18, followed by the $80.00 figure. On the upside, WTI’s first supply zone to test would be the $84.00, ahead of challenging the $85.00 a barrel.

WTI US OIL

Overview
Today last price82.94
Today Daily Change0.51
Today Daily Change %0.62
Today daily open82.43
 
Trends
Daily SMA2079.36
Daily SMA5074.51
Daily SMA10074.62
Daily SMA20076.33
 
Levels
Previous Daily High84.32
Previous Daily Low82.19
Previous Weekly High82.88
Previous Weekly Low78.49
Previous Monthly High81.78
Previous Monthly Low69.77
Daily Fibonacci 38.2%83.01
Daily Fibonacci 61.8%83.51
Daily Pivot Point S181.64
Daily Pivot Point S280.86
Daily Pivot Point S379.52
Daily Pivot Point R183.77
Daily Pivot Point R285.11
Daily Pivot Point R385.9

Author

Christian Borjon Valencia

Markets analyst, news editor, and trading instructor with over 14 years of experience across FX, commodities, US equity indices, and global macro markets.


More from Christian Borjon Valencia
Share:

Editor's Picks

AUD/USD bulls regain control above 0.6950 amid USD retreat

AUD/USD regains traction and extends the previous day's bounce from the weekly low, aiming for 0.7000 in Asia on Friday. The overnight pullback in US bond yields keeps the US Dollar below an 18-month high, which in turn offers some support to the pair. Meanwhile, hawkish RBA expectations also keep the major underpinned.

USD/JPY holds gains near 158.00 after Japan's weak Household Spending data

USD/JPY clings to gains around 158.00 after data showed on Friday that Japan's Household Spending fell for the ninth straight month, undermining the Japanese Yen. Meanwhile, the US Dollar remains depressed as the overnight fall in US bond yields counters a hawkish Fed and geopolitical uncertainties, could cap any downside in the pair.

Gold remains range-bound below $4,200

Gold has given up some ground after an initial bullish attempt to reach weekly highs, returning to below the $4,200 mark per troy ounce on Friday. The US Dollar’s strong upside momentum, combined with rising US Treasury yields across the curve, seems to keep further gains in the yellow metal under scrutiny.

Has Bitcoin really escaped the macro forces it was built to fight?
Over 17 years ago, Satoshi Nakamoto designed Bitcoin (BTC) on the back of a global financial crisis as an alternative to the global monetary system outside the control of central banks, governments and traditional intermediaries. This raises a key question: has Bitcoin really become independent of the macroeconomic forces it was built to challenge?
The Euro is not the sick man of Europe. France's bond market is
EUR/USD remains under pressure, near the 17-month low of 1.1161 reached on Monday. The pair has lost more than 7% since its yearly peak, as concerns over France's public finances increasingly weigh on the single currency. But behind the weakness of the Euro (EUR), the problem does not necessarily lie with the European economy as a whole.
Has Bitcoin really escaped the macro forces it was built to fight?
Over 17 years ago, Satoshi Nakamoto designed Bitcoin (BTC) on the back of a global financial crisis as an alternative to the global monetary system outside the control of central banks, governments and traditional intermediaries. This raises a key question: has Bitcoin really become independent of the macroeconomic forces it was built to challenge?














