|

WTI drops and extends its losses below $79.00 after an increase in US oil inventories

  • WTI extended its losses to three consecutive days beneath $80.00 a barrel.
  • US EIA reported that stockpiles had risen the most since June 2021.
  • WTI Price Analysis: Subdued but it remains slightly tilted to the downside.

Western Texas Intermediate (WTI), the US crude oil benchmark, is extending its fall to three straight days of consecutive losses, weighed by crude oil inventories in the United States (US) jumping more than estimates. Speculations of further interest rate hikes by the US Federal Reserve (Fed) bolstered the greenback, a headwind for oil prices. At the time of writing, WTI is trading at $78.40.

WTI is climbing above the 50-day Exponential Moving Average (EMA) even though US crude oil inventories have risen the most since June 2021. The US Energy Information Administration (EIA) agency revealed that crude stockpiles increased by 16.3 million barrels, in the week of February 10, to 471.4 million barrels.

Crude inventories in Cushing, Oklahoma, a delivery hub for futures, jumped by 659K last week, while refinery crude fell by 383K barrels per day. Gasoline inventories advanced by 2.3 million barrels to 241.9 million, exceeding analysts’ estimates of a 1.5 million barrels rise. Distillate inventories which account for diesel and heating oil, dropped by 1.3 million to 119.2 million, vs. expectations for a 400K barrel increase.

Aside from this, US Retail Sales for January smashed expectations and exceeded estimates. Therefore, recent Fed hawkish commentary, following Tuesday’s CPI print and today’s data, sparked speculation that the Federal Reserve would continue to tighten conditions, a tailwind for the greenback.

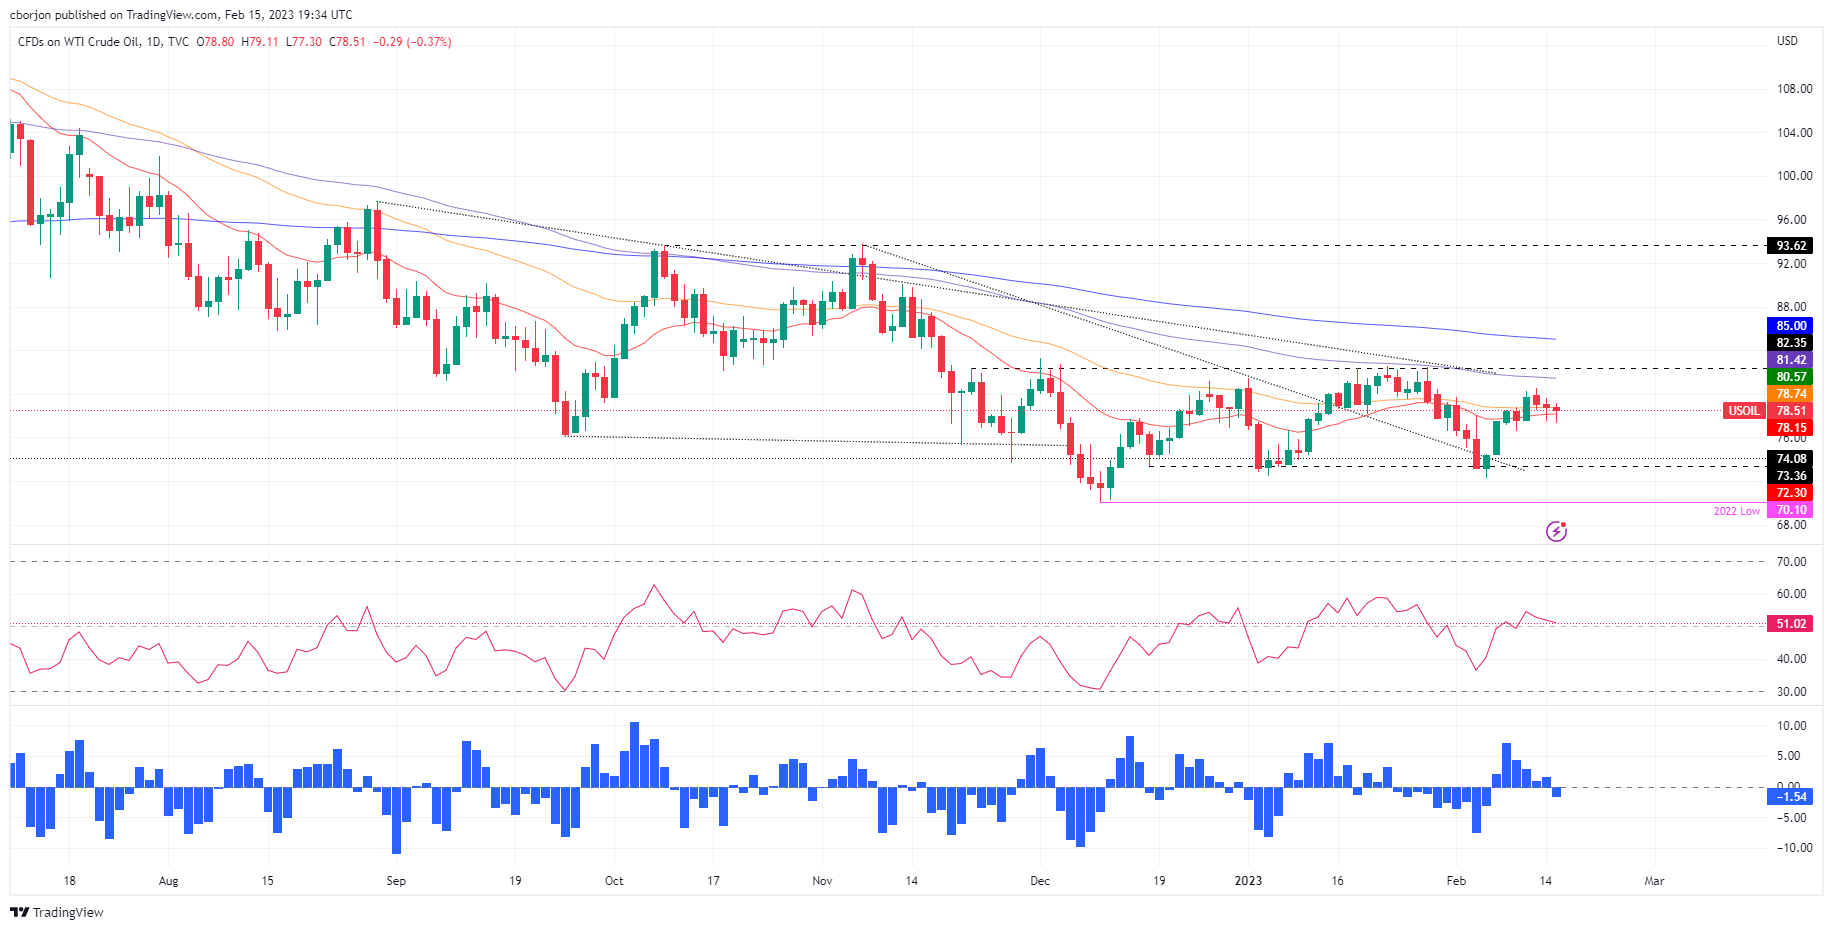
WTI Technical analysis

Albeit WTI remains neutral to downward biased, it remains consolidated in the $77.30-$80.50 range. The Relative Strength Index (RSI) in the bullish territory is almost flat, portraying oil as rangebound. In contrast, the Rate of Change (RoC) portrays sellers gaining momentum. Therefore, mixed signals suggest caution is warranted.

For WTI to resume its uptrend, it will need to conquer $80.50, which would open the door to test the 100 and 200-day EMAs, each at $81.43 and $85.00. As an alternate scenario, oil prices would resume their downtrend, with a decisive break below $77.00, dragging prices towards the YTD Low at $72.30.

WTI US OIL

Overview
Today last price78.81
Today Daily Change-0.56
Today Daily Change %-0.71
Today daily open79.37
 
Trends
Daily SMA2078.82
Daily SMA5077.61
Daily SMA10080.91
Daily SMA20089.86
 
Levels
Previous Daily High79.82
Previous Daily Low77.7
Previous Weekly High80.48
Previous Weekly Low72.5
Previous Monthly High82.68
Previous Monthly Low72.64
Daily Fibonacci 38.2%78.51
Daily Fibonacci 61.8%79.01
Daily Pivot Point S178.11
Daily Pivot Point S276.85
Daily Pivot Point S376
Daily Pivot Point R180.22
Daily Pivot Point R281.07
Daily Pivot Point R382.33

Author

Christian Borjon Valencia

Markets analyst, news editor, and trading instructor with over 14 years of experience across FX, commodities, US equity indices, and global macro markets.

More from Christian Borjon Valencia
Share:

Editor's Picks

EUR/USD slumps below 1.1750 as USD benefits from risk-aversion

EUR/USD comes under renewed bearish pressure in the European session and trades below 1.1750 following a recovery attempt earlier in the day. The US Dollar gathers strength and weighs on the pair as investors seek refuge in the wake of Israel and the United States' joint attack on Iran.

GBP/USD targets 1.3500 barrier near moving averages

GBP/USD rebounds from the daily losses, trading around 1.3450 during the Asian hours on Monday. The technical analysis of the daily chart indicates an ongoing bearish bias, as the pair trades within a descending channel pattern.

Gold surges on safe-haven demand, rises above $5,400

Gold benefits from intense risk-aversion on Monday and climbs above $5,400, setting a fresh monthly-high in the process. Tensions in the Middle East remain high as Israel and Hezbollah continue to exchange strikes following the US-Israel joint attack on Iran over the weekend.

Bitcoin, Ethereum and Ripple under pressure as key supports face breakdown risk

Bitcoin, Ethereum, and Ripple prices trade on the back foot at the start of this week on Monday, after extending losses in the previous week. BTC is on the brink of a breakdown, ETH is capped below key resistance, and XRP risks a crack of the trendline.

The market is paying for insurance, not apocalypse

As expected, this morning felt less like a Monday market open and more like a fire drill. Futures screens flickered red. S&P contracts down almost 1%. Nasdaq off 1.2%. Brent leaped 13% through $80. Gold rose 1.6% toward $5350 before paring some gains. The dollar is strutting mildly. The Swiss franc is quietly doing what it always does in a storm, catching some safe-haven flows.

Pi Network Price Forecast: Core team offloads supply, weighing on PI recovery

Pi Network  hovers below $0.1700, broadly steady at press time on Monday, attempting a recovery after a 2% loss the previous day. Sunday’s decline aligned with nearly 49 million PI tokens offloaded by the Pi Foundation, implying a spike in supply pressure that capped the prevailing four-day recovery.