WTI consolidates the bounce around $66 ahead of key OPEC+ decision


Share:
  • WTI rebounds, snapping two-day downtrend ahead of OPEC+ meet.
  • 200-DMA at $69.83 is the level to beat on the road to recovery.
  • Oversold RSI conditions caution bears but OPEC+ outcome holds the key.

WTI (NYMEX futures) is looking to find its feet in the Asian trades this Thursday, trying another recovery attempt from three-month lows of $64.31.

In doing so, the US oil is posting modest gains on the day, trading at $65.72, having faced rejection just below the $67 mark.

The market mood remains mixed amid the recent hawkish comments from Fed Chair Jerome Powell while he presents a cautious tone on persistent inflationary pressures. Growing uncertainty over the Omicron covid variant also keeps the investors away from higher-yielding currencies such as oil.

However, oil markets may be looking to reposition ahead of the critical OPEC and its allies (OPEC+) meeting, in which the alliance could pause the planned oil output increase.

Meanwhile, US Deputy Energy Secretary David Turk said on Wednesday that the timing of the strategic crude oil stockpile release could be adjusted if prices drop, per Reuters.

Looking ahead, the OPEC+ decision will be crucial for the next direction in oil. In the meantime, the broader market sentiment will continue to play its part in a potential oil-price recovery.

WTI: Technical outlook

Oversold Relative Strength Index (RSI) conditions on the daily chart suggest that a rebound could likely extend towards the 200-Daily Moving Average (DMA) at $69.83.

Ahead of that, strong offers near the $68 barrier need to be cleared on a sustained basis.

If sellers return at higher levels, then WTI could retest multi-month troughs on the $64 level, below which the additional downside will open up towards the horizontal trendline support at $62.32.

That level will be the line in the sand for WTI optimists.
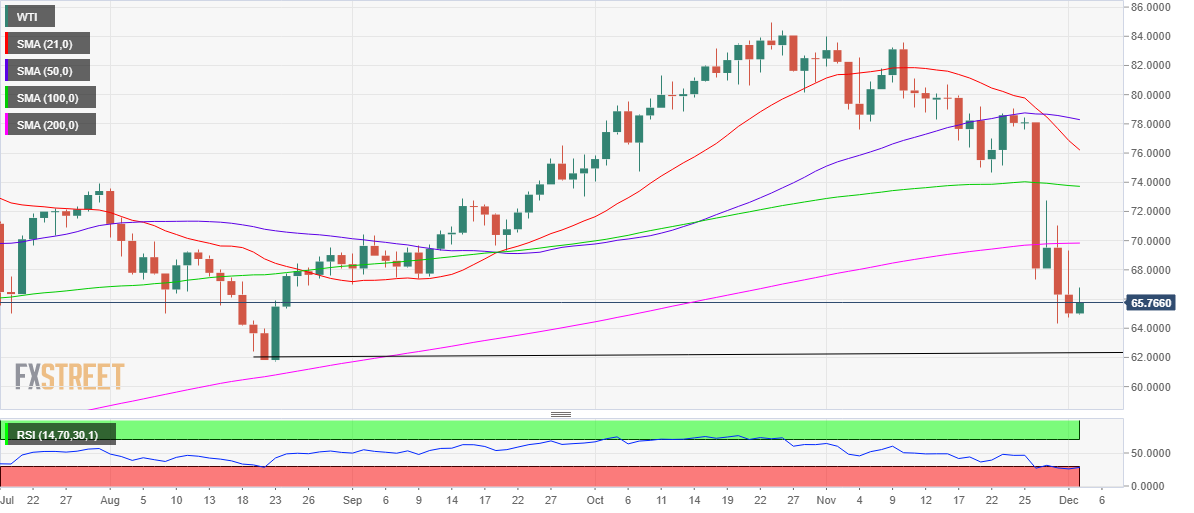
 WTI: Daily chart

WTI: Additional levels to watch

WTI

Overview
Today last price 65.78
Today Daily Change 0.76
Today Daily Change % 1.17
Today daily open 65.01
 
Trends
Daily SMA20 76.72
Daily SMA50 78.43
Daily SMA100 73.77
Daily SMA200 69.82
 
Levels
Previous Daily High 69.34
Previous Daily Low 64.73
Previous Weekly High 79.02
Previous Weekly Low 67.31
Previous Monthly High 83.97
Previous Monthly Low 64.32
Daily Fibonacci 38.2% 66.49
Daily Fibonacci 61.8% 67.58
Daily Pivot Point S1 63.38
Daily Pivot Point S2 61.75
Daily Pivot Point S3 58.78
Daily Pivot Point R1 67.99
Daily Pivot Point R2 70.97
Daily Pivot Point R3 72.6


Share: Feed news

Information on these pages contains forward-looking statements that involve risks and uncertainties. Markets and instruments profiled on this page are for informational purposes only and should not in any way come across as a recommendation to buy or sell in these assets. You should do your own thorough research before making any investment decisions. FXStreet does not in any way guarantee that this information is free from mistakes, errors, or material misstatements. It also does not guarantee that this information is of a timely nature. Investing in Open Markets involves a great deal of risk, including the loss of all or a portion of your investment, as well as emotional distress. All risks, losses and costs associated with investing, including total loss of principal, are your responsibility. The views and opinions expressed in this article are those of the authors and do not necessarily reflect the official policy or position of FXStreet nor its advertisers. The author will not be held responsible for information that is found at the end of links posted on this page.

If not otherwise explicitly mentioned in the body of the article, at the time of writing, the author has no position in any stock mentioned in this article and no business relationship with any company mentioned. The author has not received compensation for writing this article, other than from FXStreet.

FXStreet and the author do not provide personalized recommendations. The author makes no representations as to the accuracy, completeness, or suitability of this information. FXStreet and the author will not be liable for any errors, omissions or any losses, injuries or damages arising from this information and its display or use. Errors and omissions excepted.

The author and FXStreet are not registered investment advisors and nothing in this article is intended to be investment advice.

Follow us on Telegram

Stay updated of all the news

Join Telegram

Recommended content


Follow us on Telegram

Stay updated of all the news

Join Telegram

Recommended content

Editors’ Picks

EUR/USD loses traction, retreats below 1.0600

EUR/USD loses traction, retreats below 1.0600

EUR/USD lost its recovery momentum and declined below 1.0600 in the American session on Friday, erasing a portion of its daily gains in the process. Nevertheless, the risk-positive market atmosphere after PCE inflation data helps the pair limit its losses.

EUR/USD News

GBP/USD turns negative on the day below 1.2200

GBP/USD turns negative on the day below 1.2200

GBP/USD reversed its direction and slumped below 1.2200 in the American session on Friday after rising above 1.2270 earlier in the day. Position readjustments and profit-taking on the last trading day of the quarter seems to be weighing on Pound Sterling.

GBP/USD News

Gold reverses direction, drops below $1,860

Gold reverses direction, drops below $1,860

Following a steady rebound toward $1,880 on Friday, Gold price made a sharp U-turn and turned negative on the day near $1,860. Although the 10-year US T-bond yield is down more than 1%, XAU/USD struggles to find demand on the last day of Q3.

Gold News

Polkadot Price Forecast: DOT reversal seems inevitable after 92% correction from all-time high

Polkadot Price Forecast: DOT reversal seems inevitable after 92% correction from all-time high

Polkadot price, in nearly two years, has shed 92.91% from its all-time high of $55.09. The massive downswing in DOT has pushed it down to levels that were last seen in October 2020. Hence, the chances of this altcoin forming a bottom and rallying are high. 

Read more

Earnings beat triggers Nike to spike 9%

Earnings beat triggers Nike to spike 9%

Nike (NKE) stock has surged over 9% in Friday’s premarket, climbing above $98 per share, following late Thursday’s fiscal first-quarter earnings release. Nike beat pessimistic earnings expectations by more than 23% and hiked its dividend by 9%.

Read more

Forex MAJORS

Cryptocurrencies

Signatures