WiseTech Global Limited Elliott Wave technical forecast [Video]
![WiseTech Global Limited Elliott Wave technical forecast [Video]](https://editorial.fxstreet.com/images/TechnicalAnalysis/ChartPatterns/PointFigure/hand-point-to-graph-on-financial-graphs-success-concept-73251403_XtraLarge.jpg)
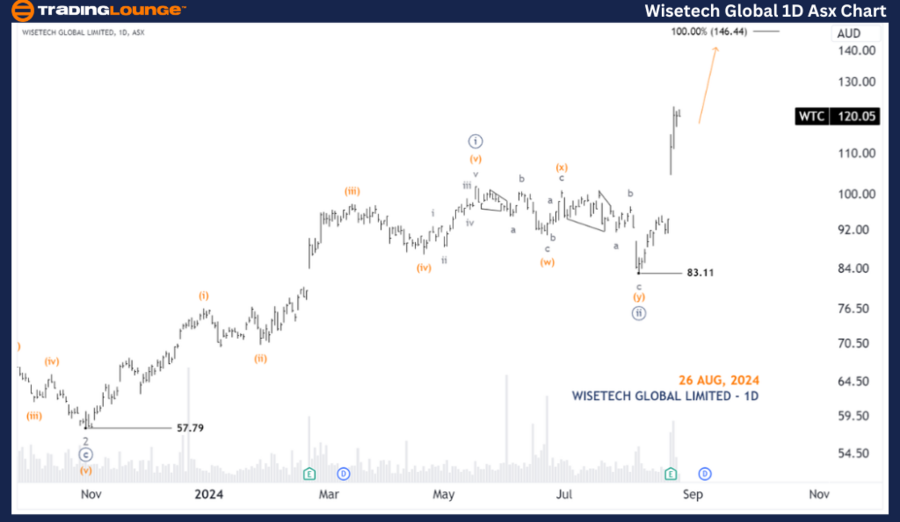
Welcome to our latest update on the Australian Stock Exchange (ASX) featuring WiseTech Global Limited (WTC). Our Elliott Wave analysis suggests that WTC.ASX might be on the verge of a significant upward movement, driven by a developing ((iii))-navy wave.
ASX: WTC Elliott Wave technical analysis
-
Trend: Major trend (Minor degree, grey).
-
Mode: Motive.
-
Structure: Impulse.
-
Position: Wave ((iii))-navy of Wave 3-grey of Wave (3)-orange of Wave ((1))-navy.
-
Details: Wave ((iii))-navy is expected to push higher, targeting the 146.44 mark. The price must stay above 83.11 to keep this outlook intact.
-
Invalidation Point: 83.11.
WTC Four-hour chart analysis
-
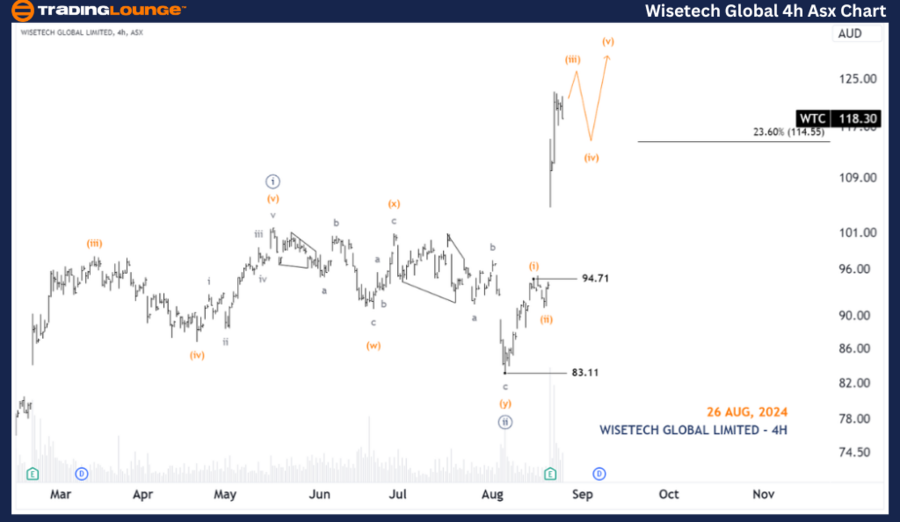
Trend: Major trend (Minute degree, navy).
-
b Motive.
-
Structure: Impulse.
-
Position: Wave (iii)-orange of Wave ((iii))-navy.
-
Details: Starting from the 83.11 low, wave ((iii))-navy is driving prices higher, subdividing into wave (iii)-orange. Although wave (iii)-orange could climb further, the upside potential appears limited as it has already advanced significantly. Following this, wave (iv)-orange may unfold, dipping slightly before wave (v)-orange resumes the upward trajectory. A move below 114.55 would indicate the start of wave (iv)-orange.
-
Invalidation Point: 94.71.
Conclusion
Our analysis and short-term forecast for ASX: WiseTech Global Limited - WTC are designed to give traders a clear understanding of current market dynamics and how to leverage them for successful trading. We provide precise price points serving as validation or invalidation signals, reinforcing the confidence in our wave count. By merging these elements, we aim to offer an objective and professional perspective on market trends.
WiseTech Global Limited Elliott Wave technical forecast [Video]
Author

Peter Mathers
TradingLounge
Peter Mathers started actively trading in 1982. He began his career at Hoei and Shoin, a Japanese futures trading company.


