Will NVIDA’s earnings crash the stock market?
/stock-market-graph-and-office-work-gm538992537-58716016.jpg)
In our previous update, we asked if the outcome of the US presidential elections could crash the stock market. Based on the Elliott Wave Principle (EWP) and market breadth, we found that the upside was more likely than the downside.
“… if the Bears cannot hold the index's price below the July ATH, we must focus on the alternative EWP count in Figure 2 below, which is the “dreaded” ending diagonal (ED). … the potential 4th wave, as shown, can become more protracted, i.e., a bounce followed by another move lower before the final 5th wave starts. Market breadth readings and sentiment are getting pretty washed out. … . Thus, the path of least resistance for these indicators appears to be up, which can propel the indexes higher.”
Fast-forwarding and the stock market rallied strongly in response to the election, which former president Donald Trump won by a landslide. Yes, markets like certainty. However, the “Trump Trade” lasted only four days, as most gains were given up the following week. The next catalyst is NVIDIA Corporation’s (NVDA) earnings. Our previous update states, “Since the NDX and NAS are often tied to the hip, it is uncommon for the two to have vastly differing EWP counts.” Below we show the NASDAQ (NAS), where we now have a better-defined potential third wave (W-3) top and W-4 underway.
Figure 1. NAS daily chart with detailed Elliott Wave count and technical indicators
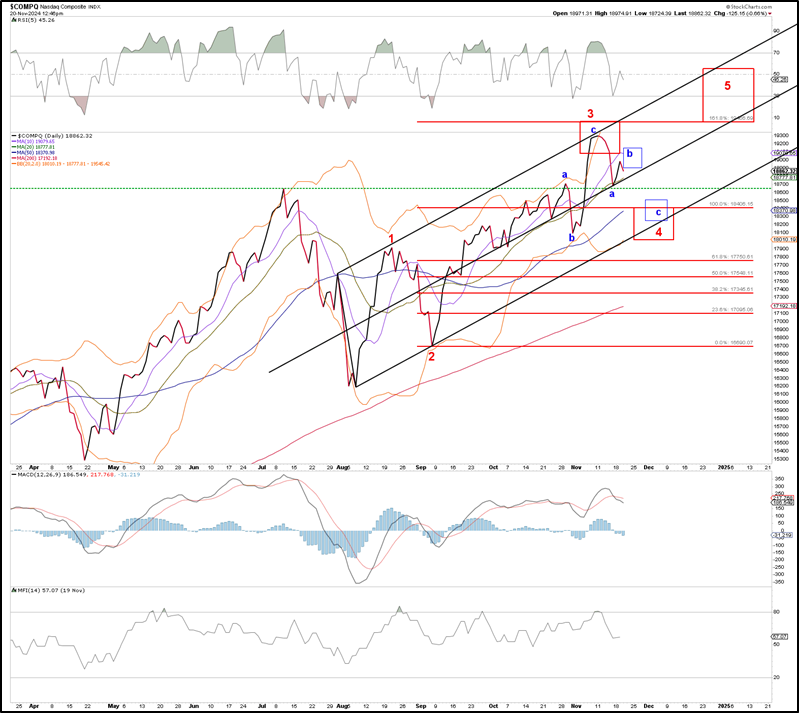
So far, the index has peaked right in the ideal target zone for a bounce (blue W-b), as we forecasted last week. Thus, a 2nd leg lower, the blue W-c, to ideally $18,350+/-150 can be reasonably expected but will only be confirmed on a daily close below $18,650. A last fifth wave, ideally $19500-20500, can commence from there.
Unfortunately, since we’re dealing with an ending diagonal, less predictable overlapping price action must be expected. That’s the hand we’re dealt and will have to work with. Namely, ED's five waves have all three wave internals (abc-abc-abc-abc-abc)—the NASDAQ100’s advance since the August low shows this well. See Figure 2 below. So each time an abc completes, the market can decide to tag on another abc, aka subdivide.
Figure 2. NDX daily chart with detailed Elliott Wave count and technical indicators
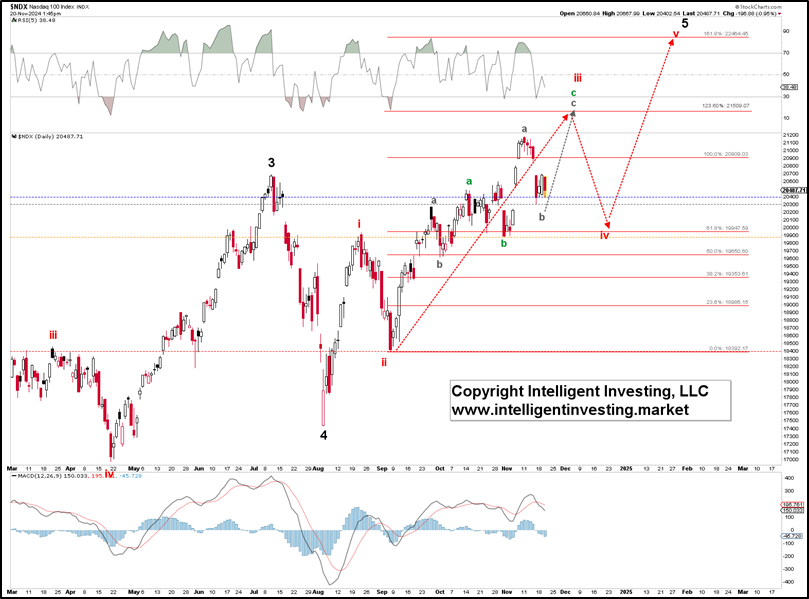
The most obvious observation from the chart is that the rally since that low has not completed five larger (red) waves up, let alone reached the 123.60% extension, which is a typical, minimal upside target for a 3rd wave (red W-iii) in an ED. Thus, we can allow another (grey) a-b-c pattern up from the October 31st low. This means the “Trump Trade” high was grey W-a, the most recent low was grey W-b, and grey W-c to ideally $21,500 is about to commence. A break above $19,200 will help confirm this thesis.
The bottom line is that NVDA’s earnings can swing the needle to lower prices temporarily, but contingent on the indexes holding above the September 6 lows, we must still expect higher prices after that.
Author

Dr. Arnout Ter Schure
Intelligent Investing, LLC
After having worked for over ten years within the field of energy and the environment, Dr.


