|

Why splendid employment data spells a bearish trend for Nasdaq?

The limelight in today's technical analysis undeniably falls upon indices, courtesy of the first Friday of the month delivering non-farm payrolls that staggeringly surpassed expectations: a solid 336,000 against the forecasted 171,000. This exhilarating number, counterintuitively, catalyzed a bearish dip in indices. And the rationale behind this somewhat paradoxical reaction? Quite straightforward, really.

When the economy performs robustly, as is the evident case here, room to elevate rates in a bid to counteract inflation becomes a palpable reality. This perspective of potential rate hikes inherently casts a shadow on indices while simultaneously propelling the American dollar, a sequence clearly evidenced in current market dynamics. The prevailing sentiment leans towards expectations of further rate augmentations.
Chart

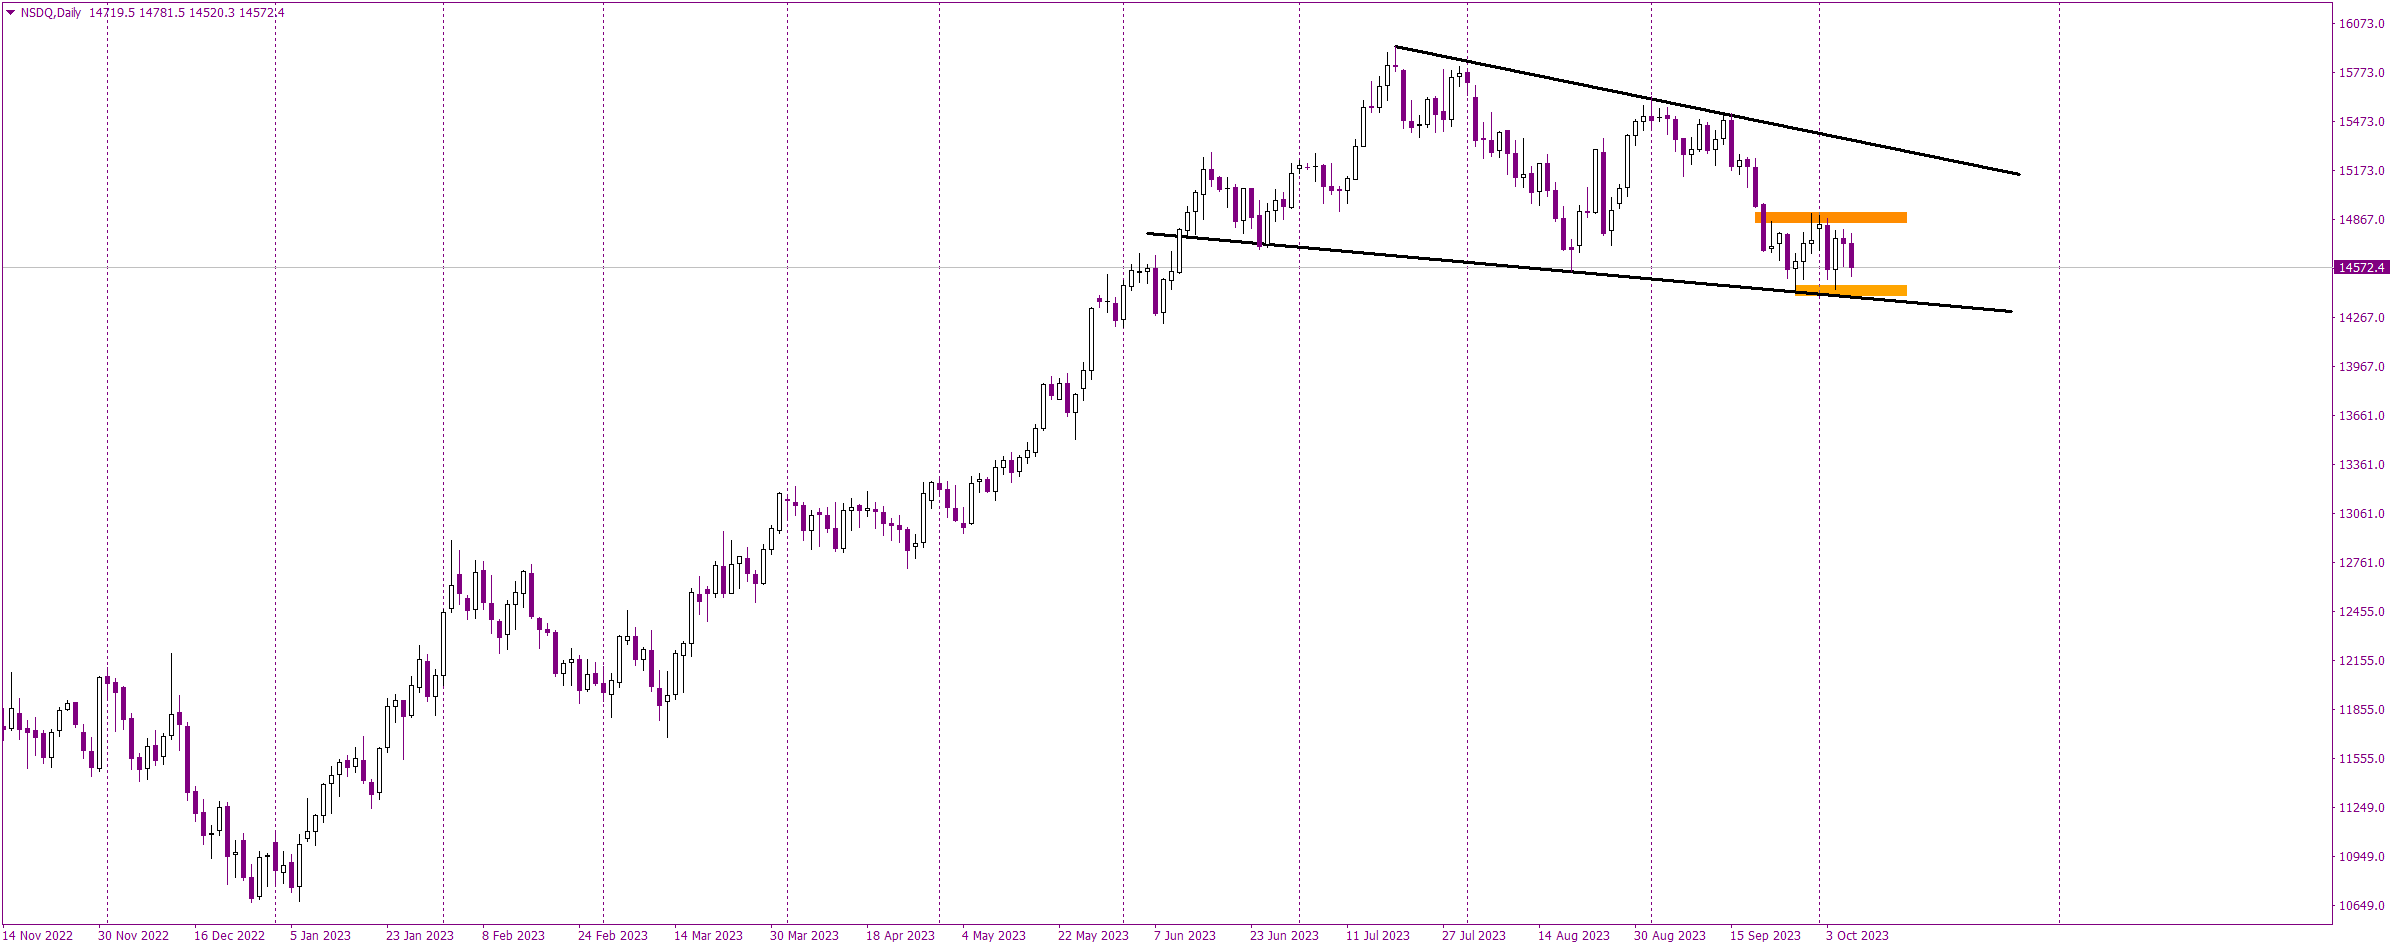
Drilling down into the technical specifics, particularly zeroing in on the Nasdaq, we observe a petite sideways trend firmly in place since the 21st of September, encapsulated between two orange lines. Zooming out for a broader perspective reveals a falling wedge pattern, delineated by black lines, wherein the lower orange and black lines stand out as pivotal supports for Nasdaq.

A descent below these two lines, marked by a price closure beneath them today, would unfurl an unambiguous sell signal, whereas maintaining a position above allows buyers to harbor a glimmer of hope for a rebound off these supports. While the current situation doesn’t explicitly unfurl a major sell signal, it lingers ominously on the horizon, with the trigger poised to be pulled upon a breakdown of those two supports.

Author

Tomasz Wisniewski

Tomasz Wisniewski

Axiory Global Ltd.

Tomasz was born in Warsaw, Poland on 25th October, 1985.

More from Tomasz Wisniewski
Share:

Editor's Picks

GBP/USD slips toward 1.3350 after soft UK CPI data

GBP/USD erases recovery gains and slips toward 1.3350 in the European session on Wednesday. The UK annual Consumer Price Index (CPI) inflation cooled to 2.6% in June against the market forecast of 2.7%, tempering the British Pound's rebound from weekly troughs. Traders also assess the ongoing Mideast tensions amid a pause in the US Dollar uptrend.

EUR/USD holds above 1.1400 amid US Dollar retreat

EUR/USD holds positive ground above 1.1400 in European trading on Wednesday, helped by hawkish ECB expectations and a broad US Dollar retreat. However, persisting Middle East tensions and surging Oil prices keep the pair's upside elusive.

Gold holds gains above $4,100 undaunted by risk-off markets

Gold extends gains for the fourth consecutive day, standing comfortably above $4,100, unfazed by the risk-off market amid rising tensions in Iran and higher Oil prices. The pair has rallied nearly 2.5% so far this week and is on track for its best weekly performance in more than three months.

Cardano: Short-term recovery lacks retail support

Cardano price edges lower after the 50-day Exponential Moving Average at $1.770 capped two consecutive days of recovery seen earlier this week. ADA futures point to waning retail traction as Open Interest and trading volume decline amid elevated long liquidations. The technical outlook for ADA is bearish, as momentum remains subdued below a resistance trendline near $0.1782.

Chip stocks are more volatile than Oil

I continue to start the day by looking at these two charts: US crude & Kospi. The former is extending gains, trading above $86 per barrel for WTI and $92 per barrel for Brent, while the Kospi is up more than 4.5%, led higher by Korean chipmakers following a similar jump in VanEck's Semiconductor ETF yesterday.

US Dollar mid-year outlook: Exceptional currency, exceptional risks?
The US Dollar enters the second half of 2026 in a markedly different position from a year ago. The King currency has recovered, reflecting persistent US inflation, changing expectations for Fed policy, geopolitical tensions and renewed demand for defensive assets.