NZD/USD spun in a tight circle on Wednesday
- NZD/USD remains firmly embedded on the bullish side heading into the back half of the trading week.
- An upswing in January's NFP print kept the US Dollar on the defensive in the midweek.

The New Zealand Dollar is holding near multi-month highs against the US Dollar following Wednesday's US Non-Farm Payrolls (NFP) report, which showed 130K jobs added in January, above the 70K forecast, but was overshadowed by an 898K downward benchmark revision to 2025 payroll data that reinforced the view of a deteriorating US labor market. The Federal Reserve (Fed) held rates at 3.50% to 3.75% at its January meeting, and markets are now pricing in two additional cuts this year as the soft labor trend points to further easing.
For the New Zealand Dollar, the Reserve Bank of New Zealand (RBNZ) is expected to hold the Official Cash Rate (OCR) at 2.25% at its February 18 meeting, with the focus on whether the bank brings forward its projected timeline for eventual rate increases. The RBNZ's easing cycle saw six cuts through 2025, bringing rates from 5.50% to 2.25%, but the economy is showing signs of stabilization and inflation is near the top of the 1% to 3% target band. Thursday brings the Business NZ Purchasing Managers Index (PMI) for January, while Friday's RBNZ Inflation Expectations for Q1 could shift rate expectations if they show upward price pressures. The week's main risk event is Friday's US Consumer Price Index (CPI) for January, with consensus at 2.5% year-over-year for the headline and 0.3% month-over-month for the core reading; a downside surprise would add further pressure on the US Dollar.
NZD/USD price forecast
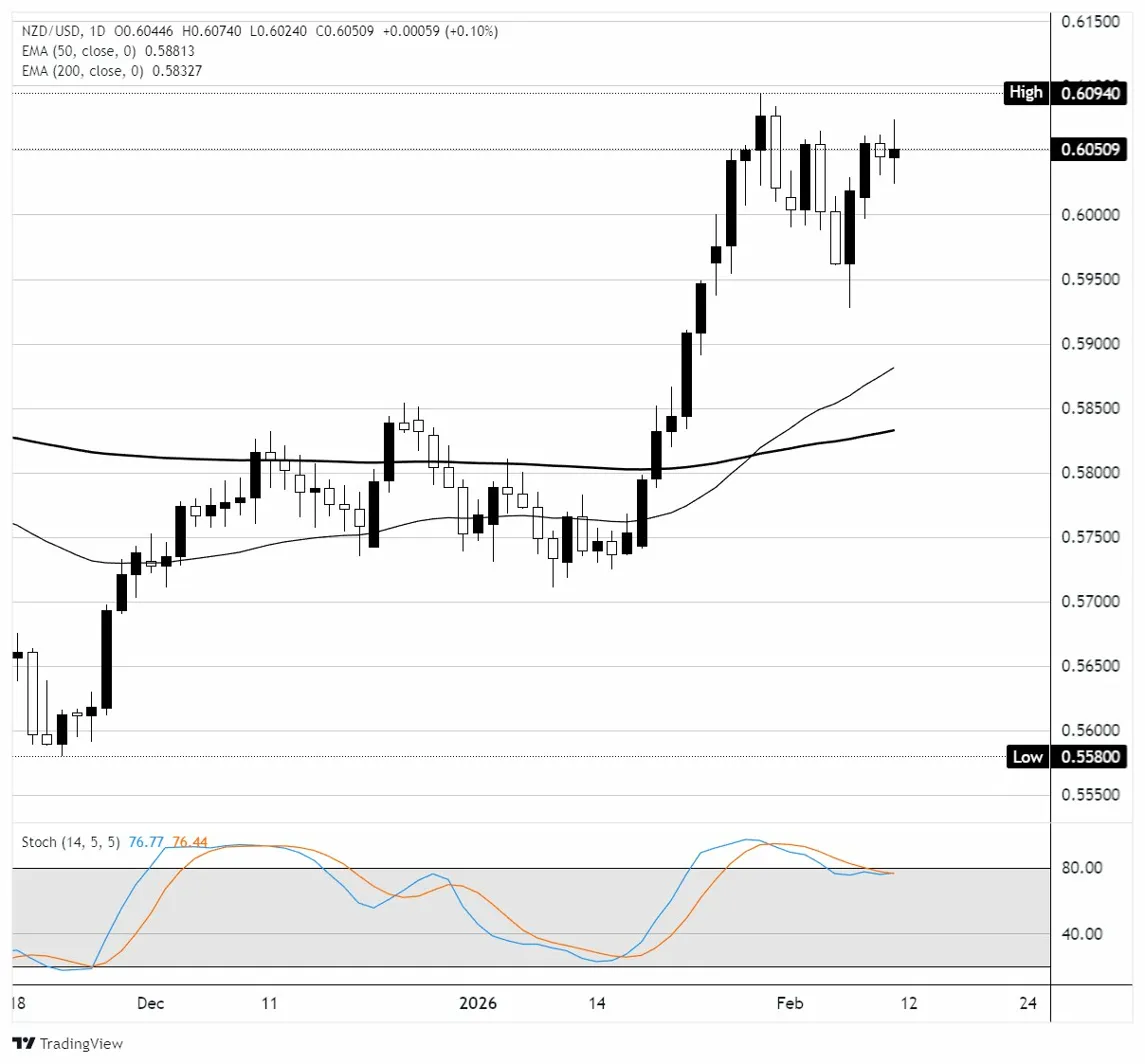
On the daily chart, NZD/USD is trading at 0.6051, up 0.10% on the session, consolidating just below the recent swing high of 0.6094. Price is well above both the 50-day Exponential Moving Average (EMA) at 0.5881 and the 200-day EMA at 0.5833, confirming a bullish trend with higher highs and higher lows since the November low near 0.5580. The pair rallied sharply from mid-January, breaking above the 0.6000 psychological level, but has spent the past week consolidating between 0.5960 and 0.6094, forming a potential bull flag or continuation rectangle. The Stochastic Oscillator (14, 5, 5) reads 76.77/76.44, in the upper range but not yet overbought, suggesting there is room for further upside before momentum becomes overextended. Key resistance stands at 0.6094, the recent high, with a break above opening the path toward 0.6150 and 0.6200. Support sits at the 0.6000 round number, followed by 0.5960, which marks the lower boundary of the current consolidation zone. A daily close above 0.6094 would confirm a bullish continuation from the flag pattern, while a breakdown below 0.5960 could trigger a deeper pullback toward the 50 EMA near 0.5881.
NZD/USD daily chart
New Zealand Dollar FAQs
The New Zealand Dollar (NZD), also known as the Kiwi, is a well-known traded currency among investors. Its value is broadly determined by the health of the New Zealand economy and the country’s central bank policy. Still, there are some unique particularities that also can make NZD move. The performance of the Chinese economy tends to move the Kiwi because China is New Zealand’s biggest trading partner. Bad news for the Chinese economy likely means less New Zealand exports to the country, hitting the economy and thus its currency. Another factor moving NZD is dairy prices as the dairy industry is New Zealand’s main export. High dairy prices boost export income, contributing positively to the economy and thus to the NZD.
The Reserve Bank of New Zealand (RBNZ) aims to achieve and maintain an inflation rate between 1% and 3% over the medium term, with a focus to keep it near the 2% mid-point. To this end, the bank sets an appropriate level of interest rates. When inflation is too high, the RBNZ will increase interest rates to cool the economy, but the move will also make bond yields higher, increasing investors’ appeal to invest in the country and thus boosting NZD. On the contrary, lower interest rates tend to weaken NZD. The so-called rate differential, or how rates in New Zealand are or are expected to be compared to the ones set by the US Federal Reserve, can also play a key role in moving the NZD/USD pair.
Macroeconomic data releases in New Zealand are key to assess the state of the economy and can impact the New Zealand Dollar’s (NZD) valuation. A strong economy, based on high economic growth, low unemployment and high confidence is good for NZD. High economic growth attracts foreign investment and may encourage the Reserve Bank of New Zealand to increase interest rates, if this economic strength comes together with elevated inflation. Conversely, if economic data is weak, NZD is likely to depreciate.
The New Zealand Dollar (NZD) tends to strengthen during risk-on periods, or when investors perceive that broader market risks are low and are optimistic about growth. This tends to lead to a more favorable outlook for commodities and so-called ‘commodity currencies’ such as the Kiwi. Conversely, NZD tends to weaken at times of market turbulence or economic uncertainty as investors tend to sell higher-risk assets and flee to the more-stable safe havens.
Author

Joshua Gibson
FXStreet
Joshua joins the FXStreet team as an Economics and Finance double major from Vancouver Island University with twelve years' experience as an independent trader focusing on technical analysis.


