Where are stock prices going next?

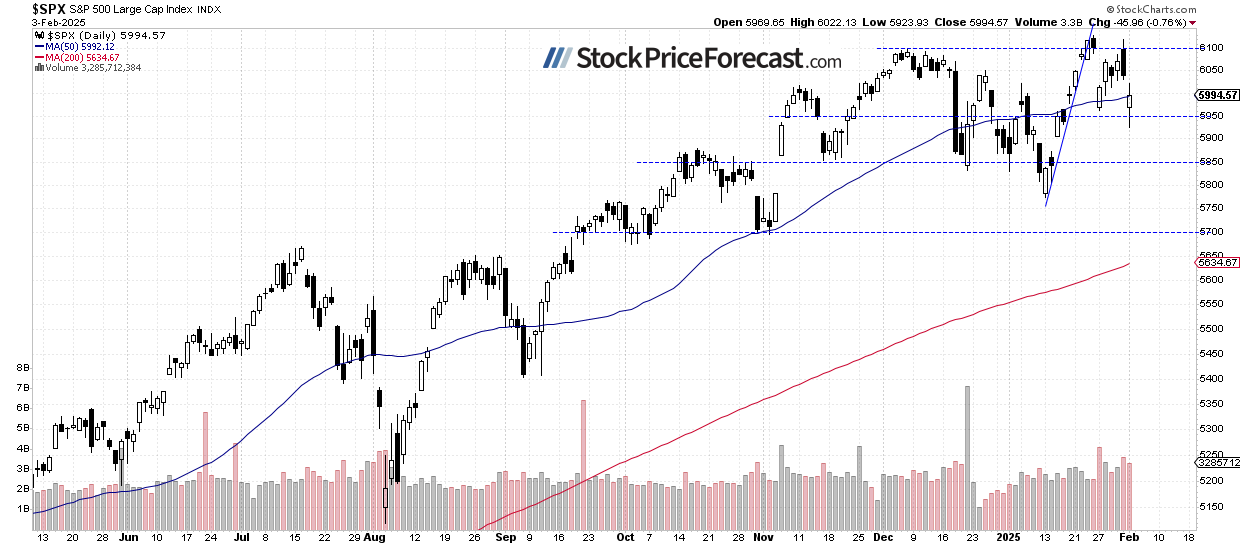
Stocks opened significantly lower on Monday, with the S&P 500 dipping below last Monday’s local low after the open. However, it rebounded and closed just 0.76% lower, retracing much of its initial decline. The index closed slightly below the 6,000 level.
Today, the S&P 500 is expected to open virtually flat, likely extending its consolidation. Investors are awaiting key jobs data at 10:00 a.m. and earnings reports from GOOG, AMD, and SNAP after the close.
Investor sentiment declined last week, as shown by Wednesday’s AAII Investor Sentiment Survey, which reported that 41.0% of individual investors are bullish, while 34.0% of them are bearish.
The S&P 500 index continues its consolidation, as we can see on the daily chart.
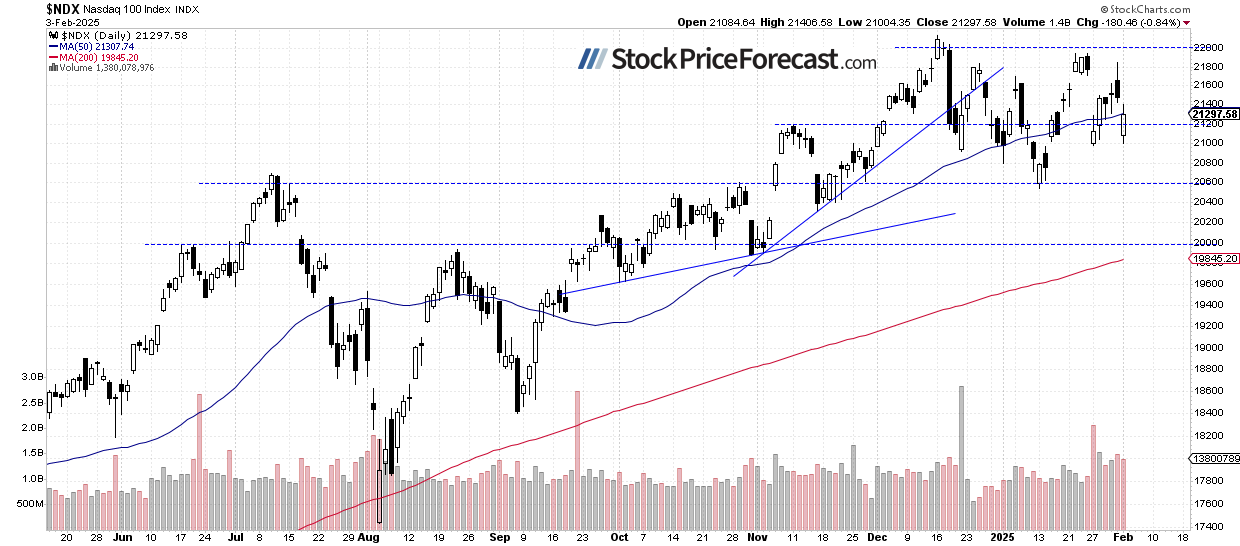
Nasdaq 100 rebounded from 21,000
The Nasdaq 100 closed 0.84% lower after rebounding from a daily low of 21,004.35. Despite earnings releases, major tech stocks continue to trade sideways.
This week, earnings reports include: AMD, GOOG (today), QCOM (tomorrow), and AMZN (Thursday); volatility is likely to remain elevated.
Resistance is around 21,800, marked by the previous trading range, while support is at 21,000, marked by recent lows.
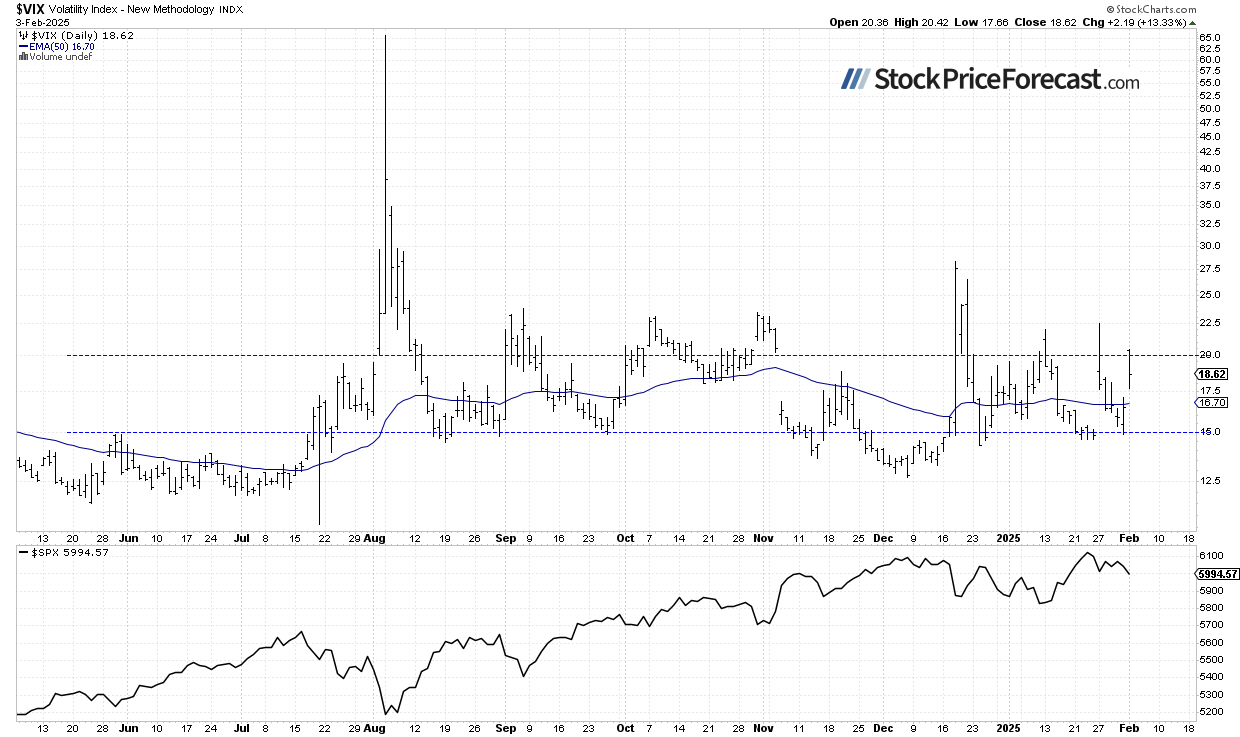
VIX: Briefly above 20
The VIX index, a measure of market volatility, advanced to the daily high of 22.51 last Monday, the highest level since December 20. However, it later retraced most of that move, falling to 14.90 on Friday. Yesterday, it briefly reached 20.42 before pulling back.
Historically, a dropping VIX indicates less fear in the market, and rising VIX accompanies stock market downturns. However, the lower the VIX, the higher the probability of the market’s downward reversal. Conversely, the higher the VIX, the higher the probability of the market’s upward reversal.
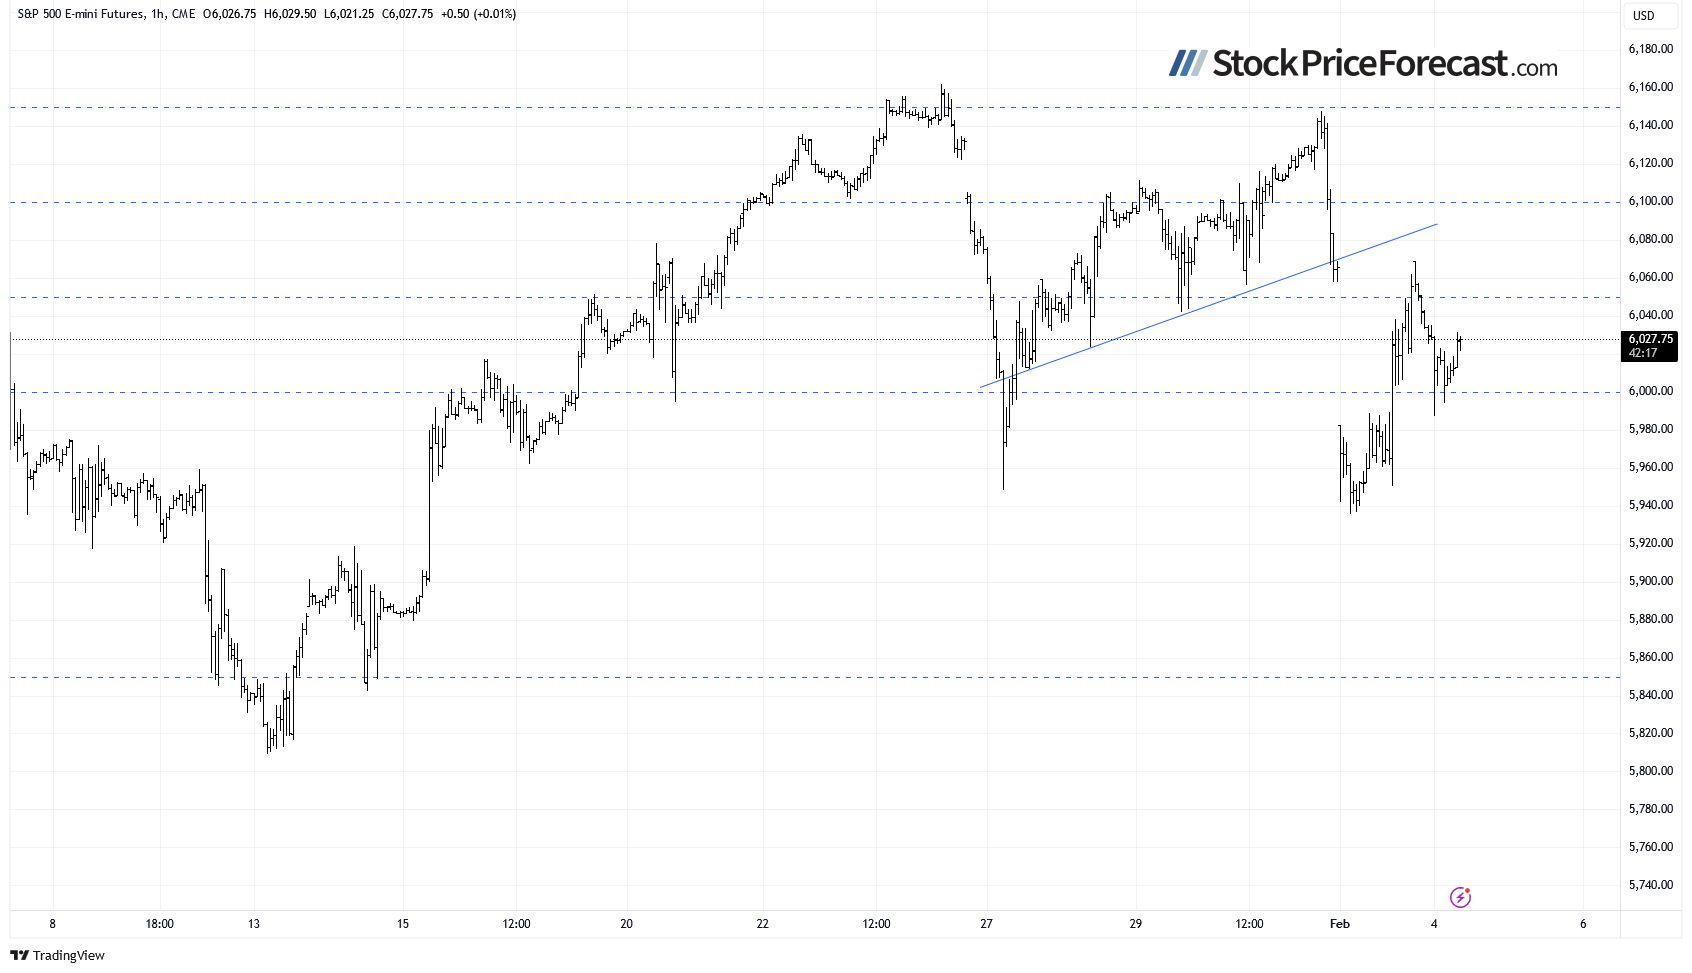
S&P 500 futures contract trades above 6,000
This morning, the S&P 500 futures contract is trading above 6,000, after rebounding from a local low of around 5,936 yesterday. Support is at around 5,900-5,950, while resistance is still at 6,000-6,050.
Conclusion
Stocks are likely to open virtually flat this morning, as the uncertainty remains despite yesterday’s rebound. Investors are closely watching earnings reports and key economic data this week. Further consolidation appears likely.
Yesterday, in my Stock Price Forecast for January 2025, I noted “...recent rallies have provided selling opportunities. What will February bring? The earnings season is in full swing, likely adding to volatility. Political developments are increasing uncertainty. The market's ongoing consolidation since November may be forming a medium-term topping pattern ahead of some more meaningful downward correction. However, no confirmed bearish signals have appeared yet.”
For now, my short-term outlook is neutral.
Here’s the breakdown:
-
The S&P 500 is likely to continue fluctuating.
-
The stock market is still seeing increased volatility following the post-election rally.
-
In my opinion, the short-term outlook is neutral.
Want free follow-ups to the above article and details not available to 99%+ investors? Sign up to our free newsletter today!
Want free follow-ups to the above article and details not available to 99%+ investors? Sign up to our free newsletter today!
Author

Paul Rejczak
Sunshine Profits
Paul Rejczak is a stock market strategist who has been known for the quality of his technical and fundamental analysis since the late nineties.


