|

Vertiv Holdings (VRT) resumed rally from predefined area

Vertiv Holdings Co., (VRT) is an American multinational provider of critical infrastructure & services for data centers, communication networks & commercial & industrial environments. It is based in Westerville, Ohio, US & comes under Industrials sector & trades as “ VRT ” ticket for NYSE.

As expected in the previous article, VRT found buyers from the daily blue box after correction ended at $62.40 low. It favors upside in V & expect new high above $109.27 to finish impulse.

VRT – Elliott Wave daily view from 7.01.2024

Chart

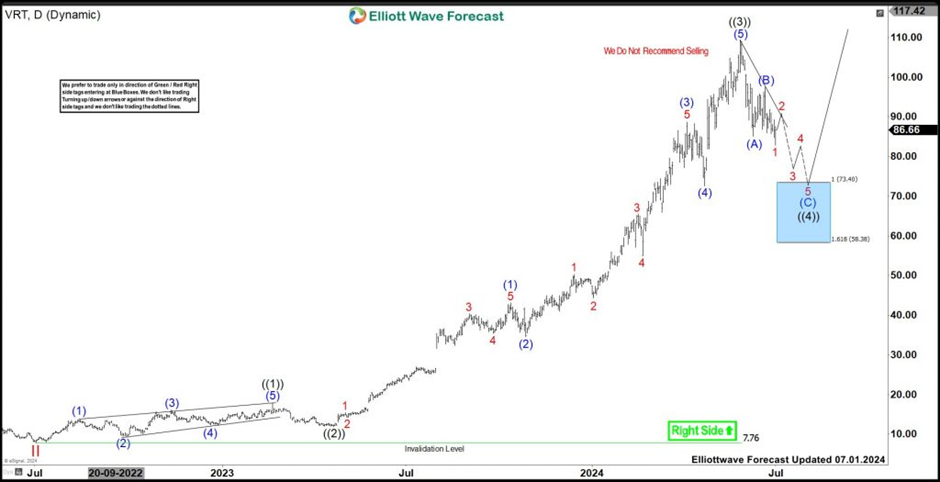
In weekly, above $4.75 low, it favors upside in (I) as impulse sequence. It placed I at $28.80 high in August-2021 & II as flat correction at $7.76 low in July-2022. Above that low, it resumed higher in extended III sequence, which ended at $109.27 high in May-2024. Within III, it placed ((1)) at $17.88 high, ((2)) at $11.95 low, ((3)) at $88.69 high, ((4)) at $72.58 low & finally ended ((5)) at $109.27 high as III.

VRT – Elliott Wave latest daily view

Chart

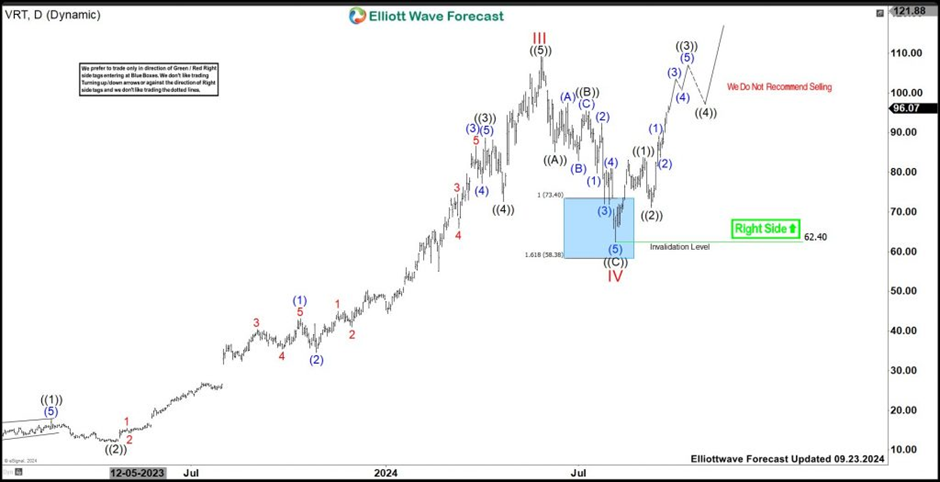
It ended IV as zigzag correction at $62.40 low expected in last article, where buyers expected to enter the market. Buyers from the daily blue box area can have risk free long position. It placed ((A)) at $85.14 low, ((B)) at 95.48 high as flat connector & ((C)) at $62.40 low. Currently, it favors upside in (3) of ((3)) & expect short term pullback to find support in 3, 7 or 11 swings to resume rally. It placed ((1)) at $83.75 high & ((2)) at 71.12 low. Further upside in V will confirm above $109.27 high & can extend towards $120.63 – $138.68 area to finish (I). Later, we like to buy the pullback in (II) at extreme areas, when reached.

VRT – Elliott Wave Latest Weekly View: 

Author

Elliott Wave Forecast Team

Elliott Wave Forecast Team

ElliottWave-Forecast.com

More from Elliott Wave Forecast Team
Share:

Editor's Picks

EUR/USD climbs to daily highs on US CPI

EUR/USD now accelerates it rebound and flirts with the 1.1880 zone on Friday, or daily highs, all in response to renewed selling pressure on the US Dollar. In the meantime, US inflation figures showed the headline CPI rose less than expected in January, removing some tailwinds from the Greenback’s momentum.

GBP/USD clings to gains above 1.3600

GBP/USD reverses three consecutive daily pullbacks on Friday, hovering around the low-1.3600s on the back of the vacillating performance of the Greenback in the wake of the release of US CPI prints in January. Earlier in the day, the BoE’s Pill suggested that UK inflation could settle around 2.5%, above the bank’s goal.

Gold: Upside remains capped by $5,000

Gold is reclaiming part of the ground lost on Wednesday’s marked retracement, as bargain-hunters seem to have stepped in. The precious metal’s upside, however, appears limited amid the slightly better tone in the US Dollar after US inflation data saw the CPI rise less than estimated at the beginning of the year.

Crypto Today: Bitcoin, Ethereum, XRP in choppy price action, weighed down by falling institutional interest 

Bitcoin's upside remains largely constrained amid weak technicals and declining institutional interest. Ethereum trades sideways above $1,900 support with the upside capped below $2,000 amid ETF outflows.

Week ahead – Data blitz, Fed Minutes and RBNZ decision in the spotlight

US GDP and PCE inflation are main highlights, plus the Fed minutes. UK and Japan have busy calendars too with focus on CPI. Flash PMIs for February will also be doing the rounds. RBNZ meets, is unlikely to follow RBA’s hawkish path.

Solana Price Forecast: Mixed market sentiment caps recovery

Solana (SOL) is trading at $79 as of Friday, following a correction of over 9% so far this week. On-chain and derivatives data indicates mixed sentiment among traders, further limiting the chances of a price recovery.