|premium|

VanEck Vectors Gold Miners ETF (GDX Stock) an incomplete sequence favors more downside [Video]

The Elliott Wave view in GDX suggests that the main cycle from the August 20, 2020 peak is showing an incomplete sequence. Favoring more downside to happen based on sequence towards $24.80- $21.36 area lower before a turn back higher happens. While the short-term cycle suggests that the decline to $30.05 low ended wave 1 of (C) in 5 waves lower. Up from there, GDX did an expanded flat correction in wave 2 bounce.

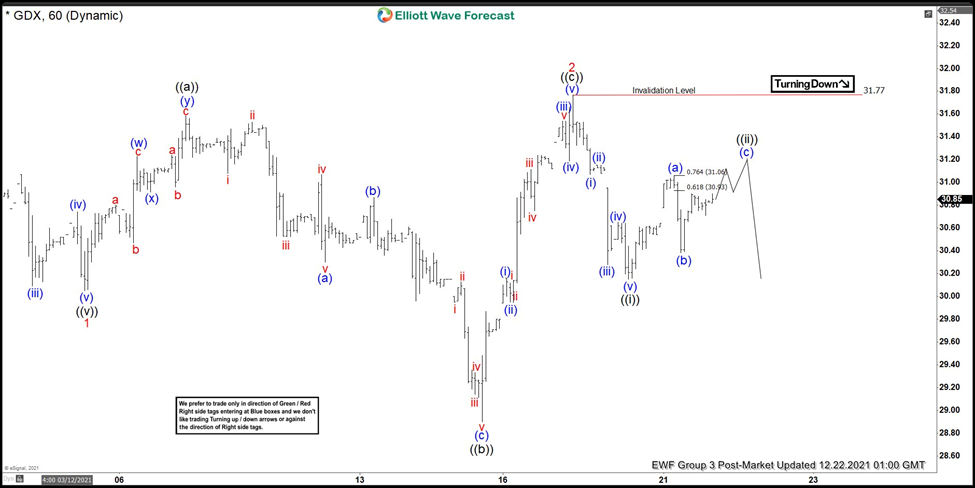
While an initial 3 swing bounce ended wave ((a)) at a $31.59 high. Down from there, wave ((b)) also ended in 3 swings at $28.90 low. Then the bounce in ((c)) leg unfolded in 5 wave impulse sequence. In which, wave (i) ended at $30.16 high, wave (ii) ended at $29.95 low, wave (iii) ended at $31.54, wave (iv) ended at $31.19 low, and wave (v) ended at $31.77 high. Thus ended wave 2 as an expanded flat correction.

Below from there, GDX declined in 5 waves lower & ended small wave ((i)) of 3 at $30.15 low. And now doing a 3 swing bounce in wave ((ii)), which can see $31.29- $31.51 area before turning lower again. Near-term, as far as bounces fail below $31.77 high then ETF is expected to fail lower looking for more downside. Alternatively, if it breaks above $31.77 high then it can even see $33.01- $34.77 area higher before seeing sellers again.

GDX 1 Hour Elliott Wave chart

GDX

GDX Elliott Wave video

Premium

You have reached your limit of 3 free articles for this month.

Start your subscription and get access to all our original articles.

Subscribe to PremiumSign In

Author

Elliott Wave Forecast Team

Elliott Wave Forecast Team

ElliottWave-Forecast.com

More from Elliott Wave Forecast Team
Share:

Editor's Picks

AUD/USD eyes 0.7150 barrier nine-day EMA

AUD/USD inches higher after registering modest losses in the previous day, trading around 0.7130 during the Asian hours. The technical analysis of the daily chart indicates that the pair is moving sideways within the rectangle pattern, suggesting a consolidation as neither the bulls nor the bears have enough momentum to take control of the market.

USD/JPY trades below 160.00 intervention threshold; bullish bias intact

The USD/JPY pair attracts some sellers during the Asian session amid fears that authorities will step in again to prop up the Japanese Yen. Furthermore, the Israel-Lebanon truce prompts some profit-taking around the US Dollar and exerts downward pressure on the currency pair.

Gold puts its 200-day SMA to the test near $4,420

Gold keeps the bullish stance in place in the latter part of Thursday’s session, although a convincing break above the key $4,500 mark per troy ounce still remains elusive. The precious metal’s advance comes amid the resurgence of some selling interest around the Greenback, improving risk sentiment, and declining US Treasury yields across the board.

Bitcoin’s massive storm is back: Why the sell-off is far from over

Bitcoin price action over the last few weeks has felt less like a normal, healthy correction and more like a slow grinding crash that continues to wreak havoc on holdings and trading accounts. And everything suggests that the dramatic crash isn’t over.

Nonfarm payrolls: Testing the limits of Fed policy patience

The upcoming nonfarm payrolls report for May will provide the final update on the US labor market before Kevin Warsh attends his first policy meeting as the new Fed Chair later this month.

Recession on paper: What really moves the Canadian Loonie now?

Statistics Canada handed the headline writers a gift and the analysts a headache. Real GDP shrank 0.1% on an annualized basis in the first quarter, and with the fourth quarter of 2025 revised down to a 1.0% contraction, that is two negative quarters in a row, the textbook definition of a technical recession and Canada's first since the pandemic.