|

VanEck Semiconductor ETF (SMH) US ETF Elliott Wave technical analysis [Video]

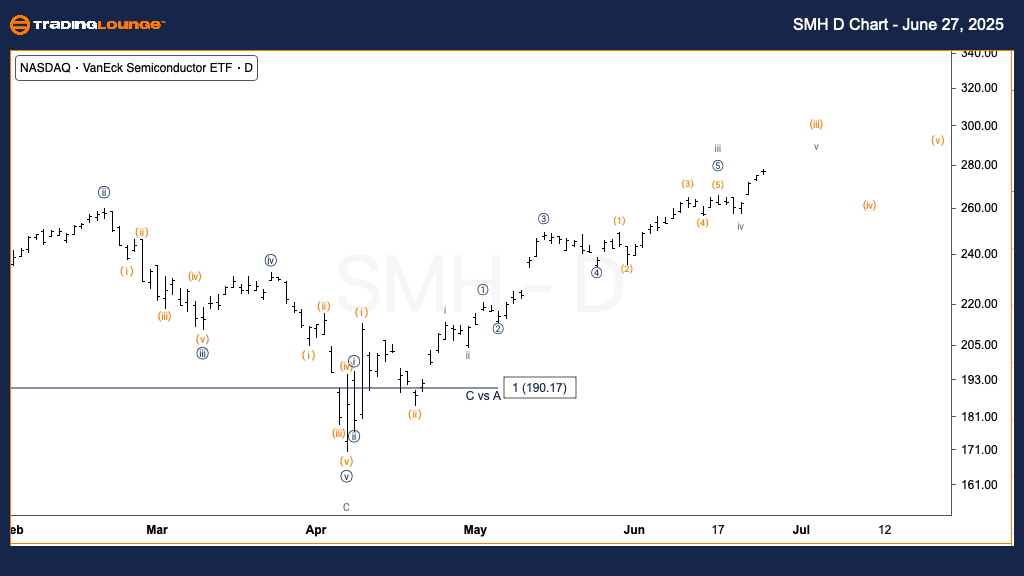
SMH Elliott Wave technical analysis – Daily chart

Function: Trend.

Mode: Motive.

Structure: Impulsive.

Position: Wave (iii) of {iii}.

Direction: Upside in wave (iii).

Details: Wave v of (iii) is unfolding. We're nearing TradingLevel3 at $300. The speed and angle of this rally support the idea that SMH is in the third wave of a third wave, typically the most aggressive phase in a bullish trend.

Chart

VanEck Semiconductor ETF (SMH) – One-hour chart

Function: Trend.

Mode: Motive.

Structure: Impulsive.

Position: Wave v of (iii).

Direction: Top in wave v.

Details: SMH is targeting the end of wave v. The first wave v target is $282, aligned with a 0.618 Fibonacci extension relative to wave i. This is a typical projection and may mark a short-term high before entering wave (iv) correction.

This analysis highlights the current market structure of the VanEck Semiconductor ETF (SMH) using Elliott Wave Theory. Both daily and hourly timeframes suggest bullish momentum with specific wave levels offering insight into upcoming market behavior.

Daily chart summary

SMH remains strong within wave (iii) of {iii}, often the most powerful stage in an Elliott wave. As the price nears the $300 mark, bullish signals remain intact.

One-hour chart summary

SMH is likely reaching the top of wave v of (iii), with $282 as an immediate upside target. This may lead into a brief corrective wave (iv) before another advance.

VanEck Semiconductor ETF (SMH) US ETF Elliott Wave technical analysis [Video]

Author

Peter Mathers

Peter Mathers

TradingLounge

Peter Mathers started actively trading in 1982. He began his career at Hoei and Shoin, a Japanese futures trading company.

More from Peter Mathers
Share:

Markets move fast. We move first.

Orange Juice Newsletter brings you expert driven insights - not headlines. Every day on your inbox.

By subscribing you agree to our Terms and conditions.

Editor's Picks

EUR/USD trims losses and returns to the 1.1750 area

The US Dollar resumed its decline in the American afternoon, helping EUR/USD trim early losses. The pair trades around 1.1750 as market participants gear up for the European Central Bank monetary policy decision and the United States Consumer Price Index.

GBP/USD flirts with 1.3400 after nearing 1.3300

The GBP/USD changed course after dipping with UK inflation data, and trades near the 1.3400 mark, as investors expect the Bank of England to deliver a 25 basis points interest rate cut after the two-day meeting on Thursday.

Gold maintains its positive momentum, trades around $4,330

The XAU/USD pair gained on a deteriorated market mood, trading near its weekly highs near $4,340. The bright metal advances with caution as market players await first-tier events in Europe and hte United States.

Bitcoin risks deeper correction as ETF outflows mount, derivative traders stay on the sidelines

Bitcoin (BTC) remains under pressure, trading below $87,000 on Wednesday, nearing a key support level. A decisive daily close below this zone could open the door to a deeper correction.

Monetary policy: Three central banks, three decisions, the same caution

While the Fed eased its monetary policy on 10 December for the third consecutive FOMC meeting, without making any guarantees about future action, the BoE, the ECB and the BoJ are holding their respective meetings this week. 

Crypto Today: Bitcoin, Ethereum, XRP slide further as risk-off sentiment deepens

Bitcoin faces extended pressure as institutional investors reduce their risk exposure. Ethereum’s upside capped at $3,000, weighed down by ETF outflows and bearish signals. XRP slides toward November’s support at $1.82 despite mild ETF inflows.