VanEck Semiconductor ETF (SMH) Elliott Wave technical analysis [Video]
![VanEck Semiconductor ETF (SMH) Elliott Wave technical analysis [Video]](https://editorial.fxstreet.com/images/Markets/Equities/market-analyze-18914145.jpg)
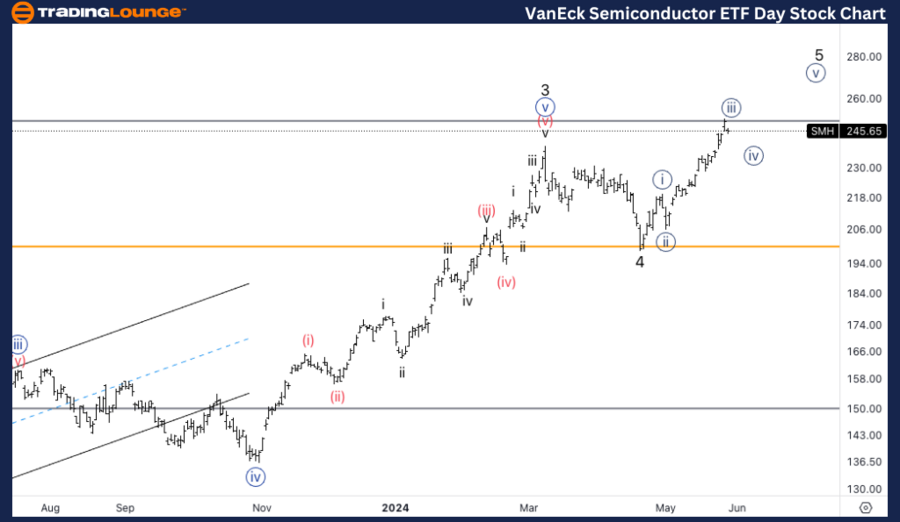
VanEck Semiconductor ETF (SMH) daily chart
SMH Elliott Wave technical analysis
Function: Trend.
Mode: Impulsive.
Structure: Motive.
Position: Minor 5.
Direction: Upside in Minor 5.
Details: We have hit Medium Level at 250$, looking for a potential wave {iv} of 5 to start moving sideways.
SMH Elliott Wave technical analysis – Daily chart
In our Elliott Wave analysis of the VanEck Semiconductor ETF (SMH) on May 30, 2024, we observe an impulsive trend characterized by a motive structure. SMH is currently positioned in Minor wave 5, indicating an upside movement in Minor wave 5. Having hit the Medium Level at $250, we anticipate a potential wave {iv} of 5 to start moving sideways. Traders should monitor this key level for signs of consolidation before the trend potentially continues higher.
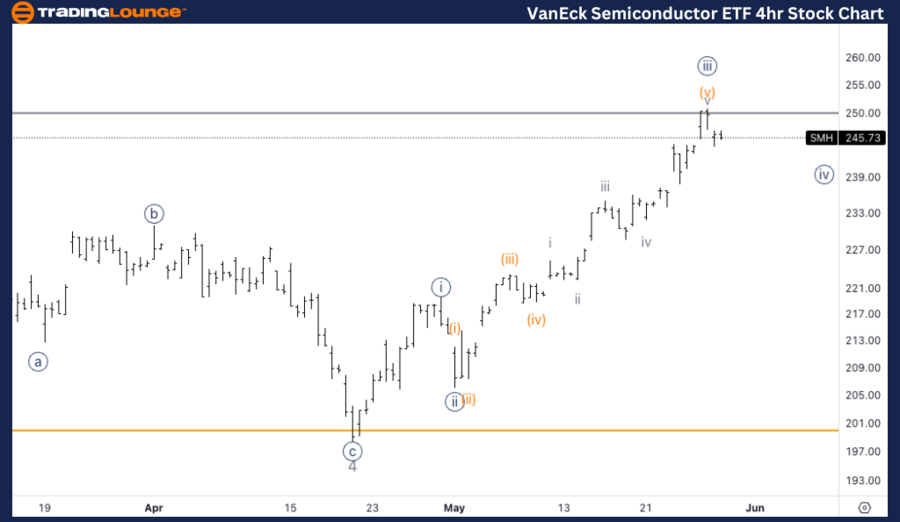
SMH Elliott Wave technical analysis
Function: Trend.
Mode: Impulsive.
Structure: Motive.
Position: Minor 5.
Direction: Correction in wave {iv}.
Details: Wave {iii} sub counts suggests we could have found a top in wave {iii}, as well as hitting 250$. Looking for a sideways wave {iv} to then continue higher towards MG2.
SMH Elliott Wave technical analysis – Four-hour chart
On the 4-hour chart, SMH is following an impulsive trend within a motive structure, specifically in Minor wave 5. The subcounts of wave {iii} suggest we could have found a top in wave {iii}, particularly given the recent hit at the $250 level. We expect a sideways movement in wave {iv} before resuming the upward trend towards MG2. This corrective phase provides an opportunity to reassess positions and prepare for the next bullish move.
VanEck Semiconductor ETF (SMH) Elliott Wave technical analysis [Video]
Author

Peter Mathers
TradingLounge
Peter Mathers started actively trading in 1982. He began his career at Hoei and Shoin, a Japanese futures trading company.


