USD/ZAR Price Analysis: Remains trapped between two key averages above $14 mark
- USD/ZAR in the red for the third straight day, but holds $14.
- The spot needs acceptance 50-SMA on the 4H chart to break the range play.
- 100-SMA guards the downside, as bulls look to take over control.
USD/ZAR is making another attempt to recapture the key horizontal resistance at $14.27, which is represented by the 50-Simple Moving Average (SMA) on the four-hour chart.
Note that the spot has been failing to find acceptance above the latter since July 2. Therefore, the price has been side-lined in a narrow range, although holding onto the $14 mark.
At the time of writing, the spot is posting small losses, trading at $14.25. The downside remains cushioned at the upward-sloping 100-SMA at $14.17.
The $14 support could be the last line of defense for the buyers.
USD/ZAR four-hour chart
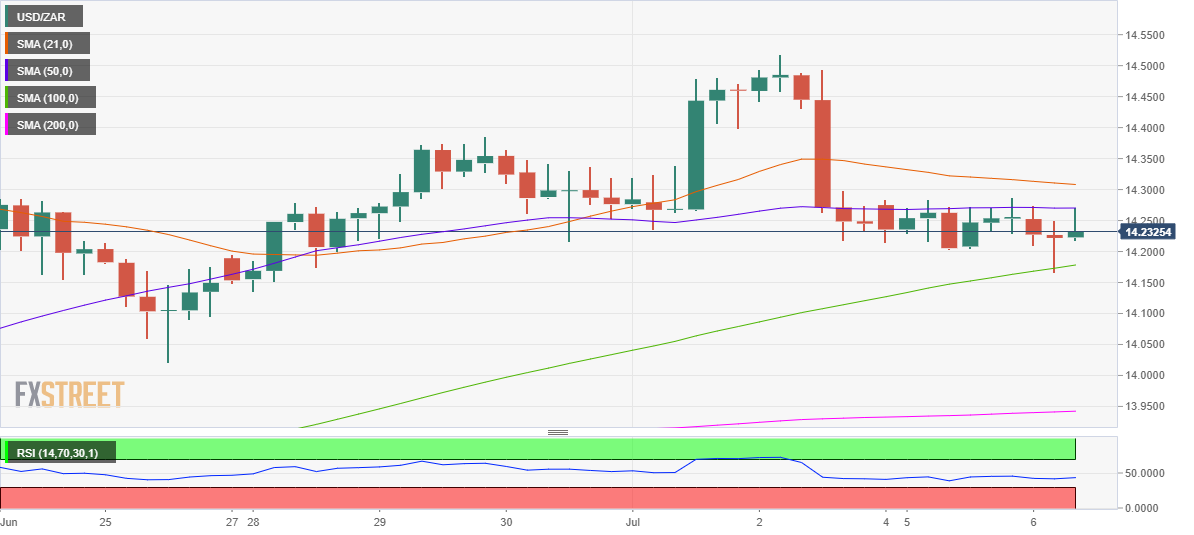
With the Relative Strength Index (RSI) inching higher towards the midline, the bulls seem to receive fresh signs of life.
However, the leading indicator still remains below the 50 level, implying that the upside may appear elusive.
Only a four-hourly candlestick closing above the 50-SMA could offer a much-needed boost to the bullish traders.
The next upside target for USD/ZAR is then seen at the mildly bearish 21-SMA at $14.30.
Author

Dhwani Mehta
FXStreet
Residing in Mumbai (India), Dhwani is a Senior Analyst and Manager of the Asian session at FXStreet. She has over 10 years of experience in analyzing and covering the global financial markets, with specialization in Forex and commodities markets.


