- USD/TRY sellers take a breather following two-day downtrend.
- Overbought RSI, SMA breakdown signals further pullback.
- Seven-week-old support line challenges the bears, bulls eye record top.
USD/TRY seesaws near $9.5430-25, keeping the previous day’s 5-DMA breakdown ahead of Wednesday’s European session. The Turkish Lira (TRY) pair dropped during the last two days after refreshing the all-time high earlier in the week.
Although overbought RSI and the near-term moving average breakdown favor USD/TRY sellers, an upward sloping support line from September 07, near $9.2170, restricts immediate downside.
Even if the pair sellers conquer the $9.2170 level, the $9.000 threshold and September’s peak around $8.9590 will question the further downside.
Meanwhile, recovery moves need to cross the 5-DMA hurdle of $9.5590 to recall the USD/TRY bulls.
Following that, the $9.6000 and $9.6660 may prone the advances before the all-time high of $9.8505.
In a case where the USD/TRY run-up remains intact beyond $9.8505, the $9.9000 psychological magnet will be in focus.
USD/TRY: Daily chart
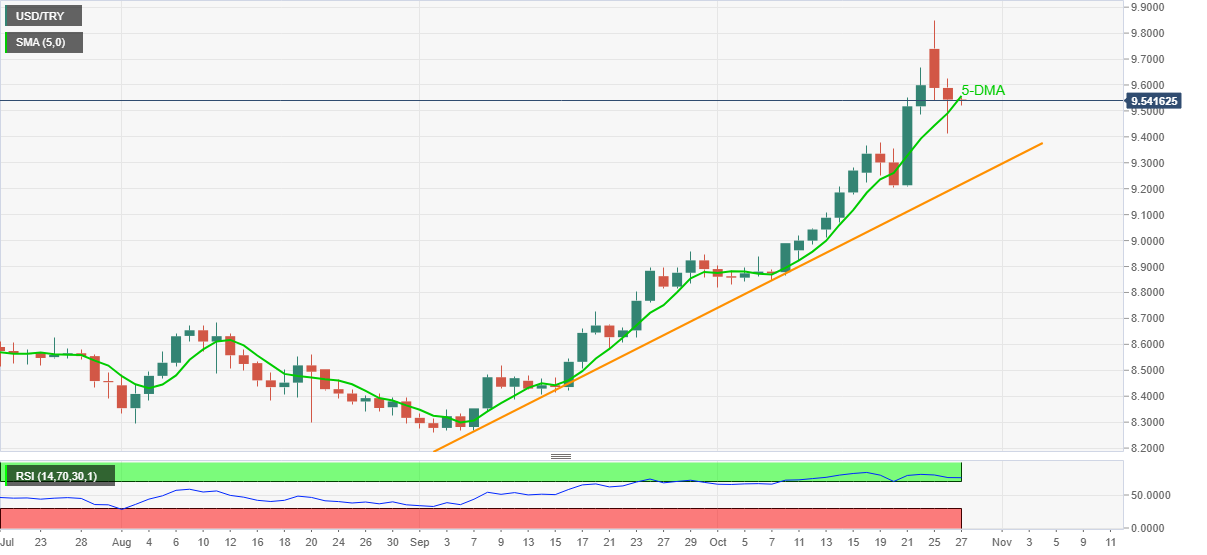
Trend: Bullish
Information on these pages contains forward-looking statements that involve risks and uncertainties. Markets and instruments profiled on this page are for informational purposes only and should not in any way come across as a recommendation to buy or sell in these assets. You should do your own thorough research before making any investment decisions. FXStreet does not in any way guarantee that this information is free from mistakes, errors, or material misstatements. It also does not guarantee that this information is of a timely nature. Investing in Open Markets involves a great deal of risk, including the loss of all or a portion of your investment, as well as emotional distress. All risks, losses and costs associated with investing, including total loss of principal, are your responsibility. The views and opinions expressed in this article are those of the authors and do not necessarily reflect the official policy or position of FXStreet nor its advertisers. The author will not be held responsible for information that is found at the end of links posted on this page.
If not otherwise explicitly mentioned in the body of the article, at the time of writing, the author has no position in any stock mentioned in this article and no business relationship with any company mentioned. The author has not received compensation for writing this article, other than from FXStreet.
FXStreet and the author do not provide personalized recommendations. The author makes no representations as to the accuracy, completeness, or suitability of this information. FXStreet and the author will not be liable for any errors, omissions or any losses, injuries or damages arising from this information and its display or use. Errors and omissions excepted.
The author and FXStreet are not registered investment advisors and nothing in this article is intended to be investment advice.
Recommended content
Editors’ Picks
AUD/USD eases toward 0.6650 after dismal Aussie trade data

AUD/USD has stalled its advance and reverted toward 0.6650 after the Australian Trade Surplus shrank more than expected in April. The renewed uptick in the US Dollar amid firmer US Treasury bond yields are capping the pair's upside. US data next in focus.
EUR/USD regains 1.0700 as US Dollar stays on the back foot

EUR/USD is trading above 1.0700, as bulls keep the reins for the second consecutive day early Thursday. The major currency pair fails to justify looming economic fears and upbeat US Treasury bond yields amid a broadly weaker US Dollar. Final Eurozone Q1 GDP eyed.
Gold: 100 DMA appears a tough nut to crack for sellers Premium

Gold price is attempting a bounce from near the $1,940 region early Thursday. Gold price shredded 1% in Wednesday’s trading after the US Treasury bond yields spiked on the surprise rate hike decision announced by the Bank of Canada (BoC), following a pause since March.
Dogecoin price could rally 30% if DOGE history over the last six months is enough to go by

Dogecoin price has been trading within a fixed range over the last six months, taking seasonal leaps as volatility increased. With this accumulation pattern, the king of meme coins could be en route to complete the next bounce cycle.
Is the meltdown happening?

It feels like the US economy just left the highest level tower. Just dived off. With the full free-fall ramifications only now beginning to truly seep into the consciousness of investors. As is often the case, the real world Main Street situation can have a long lead time on major stock market price shifts.