USD/TRY Price Analysis: Nears 100-SMA support after persistent rejection at $8.40
- USD/TRY remains pressured for the second straight day.
- Technical setup on the 4H chart remains in favor of bears.
- Sellers needs a sustained break below 100-SMA for fresh entry.

USD/TRY is trading with a negative bias for the second straight day on Friday, although remains well within Thursday’s range below $8.50.
As observed on the four-hour chart, the spot continues to face rejection above the ascending 50-simple moving average (SMA) at $8.3930.
Therefore, the sellers remain in control, with the downside accentuated on a breach of the mildly bullish 21-SMA at $8.37.
With the offered tone intact, a test of the horizontal 100-SMA at $8.33 remains inevitable.
It's going to be an uphill battle for the bulls to defend the latter, as the Relative Strength Index (RSI) has pierced through the midline, now trending within the bearish zone.
If the losses deepen, the 200-SMA at $8.25 could come into play.
USD/TRY: Four-hour chart
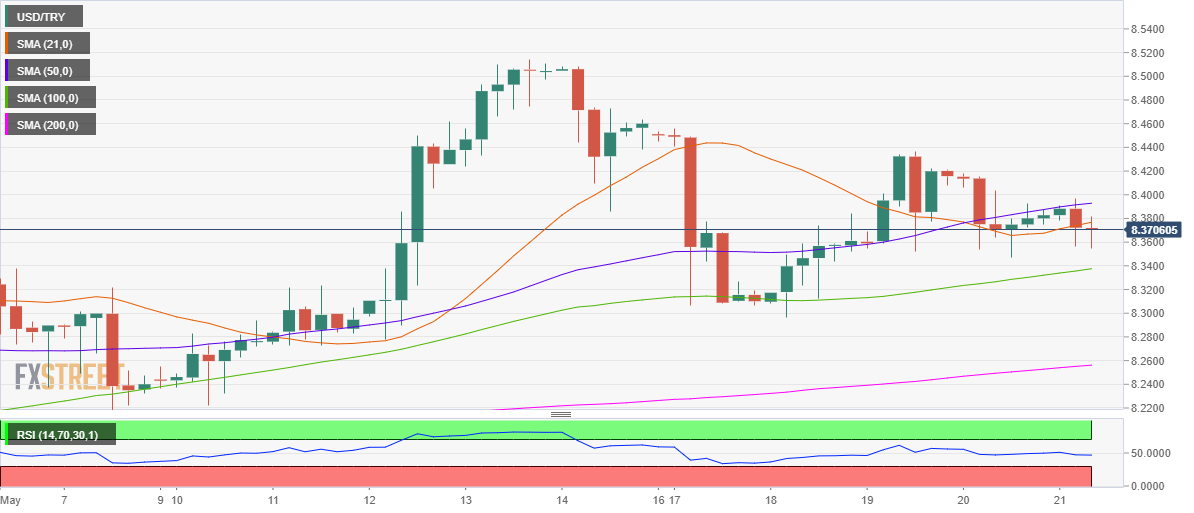
Alternatively, recapturing the 50-SMA on a four-hourly candlestick closing basis is critical to resuming the uptrend towards the record highs above $8.51.
Ahead of that level, the May 19 high at $8.4365 could test the bullish commitments.
Author

Dhwani Mehta
FXStreet
Residing in Mumbai (India), Dhwani is a Senior Analyst and Manager of the Asian session at FXStreet. She has over 10 years of experience in analyzing and covering the global financial markets, with specialization in Forex and commodities markets.
















