USD/TRY Price Analysis: Bulls seeking a bullish extension from daily support
- USD/TRY is ripening for a long opportunity to target a bullish extension of the last bullish impulse.
- Bears are in control for the time being and environment needs to shift on the lower time frames.

USD/TRY has been a complicated series of the price action of late, but the following is an illustration of how technical analysis from a top-down perspective can help to unravel that chaos of volatility and offer a structured approach to swing-trading.
We will start from a monthly analysis to a weekly, daily and work from a 4-hour time frame to manage price action and determine an optimal entry point, stop loss and target.
Monthly chart
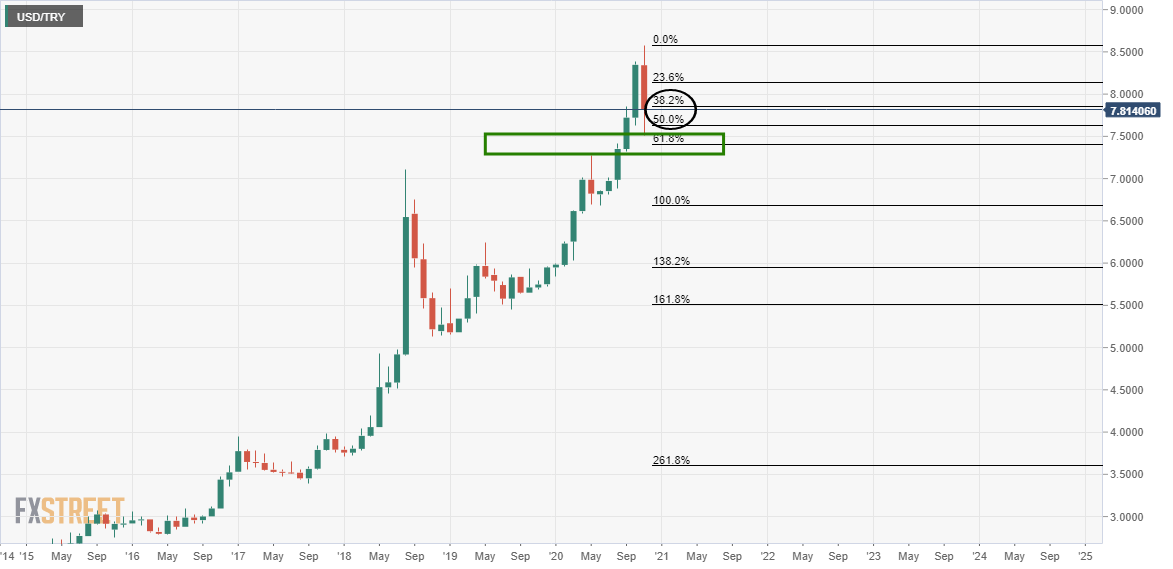
The monthly chart shows that the price was rejected in a strong bearish impulse following a series of uninterrupted bullish months.
This signifies that we could be in for a long and gruelling period of distribution.
There is probably little to do be done here from an 'investment' standpoint until bulls take charge again, pushing the price higher for sellers to re-enter at higher levels in the pursuit of much lower prices.
Traders can use this type of information for a foundation on how to approach the price action on lower time frames, confident that there will be a monthly range to work within.
However, what is compelling is that the price has already fallen significantly (to between 50% and a 61.8% Fibonacci of the last bullish impulse).
Some consolidation with a bullish bias can be expected prior to the next test lower towards 7.2683, or, May's monthly candle's highs.
Weekly chart
-637423549979996854.png)
The most compelling aspect of the weekly chart is the correction of the bearish impulse.
The price has fallen and tested support.
It has corrected around 50% of the drop and has left a weekly long wick for the prior week.
At the start of this week, the price is opening bullish and seeking to fill in the wick.
This gives rise to a potential trading opportunity on the daily chart, as follows:
Daily chart
-637423554196922205.png)
As illustrated, the daily fractal of the weekly chart shows that where the weekly wick is represented as a daily correction of the weekly rally, it can be expected that a fresh daily impulse will emerge from the chaos.
This is shown by the green bullish arrow on this chart above, within the eclipse.
The target area would be around the midpoint of the contraction within the two daily largest bearish candles of the weekly bearish impulse.
This resistance structure has been shown as a red box on the chart above, with the contraction candle that has been eclipsed.
What adds further conviction, is that the daily price action has been supported, (green support box), at a significant area of market structure.
There will be a continuation trade to the upside if the price manages to break the current resistance and holds above it on a restest.
For the time being, it is prudent to approach the market one step at a time and be paid on the highest probability trading opportunity.
Moving down to the 4-hour, we can identify more accurately the near term price action, structure and pinpoint the stop loss, entry and target area:
4-hour chart
-637423565801178605.png)
Evidently, there is still some work left to do from the bulls.
While buying now would be the best price in hindsight, traders may seek more conviction and letting this play out a little more until certain criteria have been met.
For instance, according to the lagging technical indicators, the 4-hour time frame is still in a bearish environment. MACD is still below zero and the price is still below the 21-moving average. Moreover, the price is still below the resistance structure of prior candles.
Therefore, the price will need to break higher and bulls will seek such confirmation of a bullish environment before deciding to get involved.
However, a discount from the newly formed bullish market structure will be required to improve the risk to reward ratio (R/R).
A buy limit order can be placed to meet such criteria.
Author

Ross J Burland
FXStreet
Ross J Burland, born in England, UK, is a sportsman at heart. He played Rugby and Judo for his county, Kent and the South East of England Rugby team.


