USD/TRY Price Analysis: Bears keep the reins 21-day SMA, three-week-old resistance line
- USD/TRY sellers catch a breather after flashing the biggest gains in one week the previous day.
- Failures to cross the key resistances, normal RSI conditions keep sellers hopeful.

USD/TRY licks its wounds around 7.7860, up 0.16% intraday, during the early Asian session on Friday. The pair marked a U-turn from a short-term resistance line and 21-day SMA on Thursday, amid normal RSI conditions, which in turn suggest further weakness by the quote.
During the anticipated fall, 100-day SMA near 7.6160 gains major attention with the recent low near 7.7430 acting as immediate support.
Although the USD/TRY buyers are likely to return from 7.6160, their failure to do so can make the quote vulnerable to decline towards November’s low near 7.5060.
Meanwhile, the 21-day SMA level of 7.8493 acts as nearby resistance for the pair ahead of highlighting a falling trend line from November 11, currently around 7.9035.
In a case where the USD/TRY buyers manage to conquer 7.9035, late-November tops near 8.0510 will gain the market’s attention.
USD/TRY daily chart
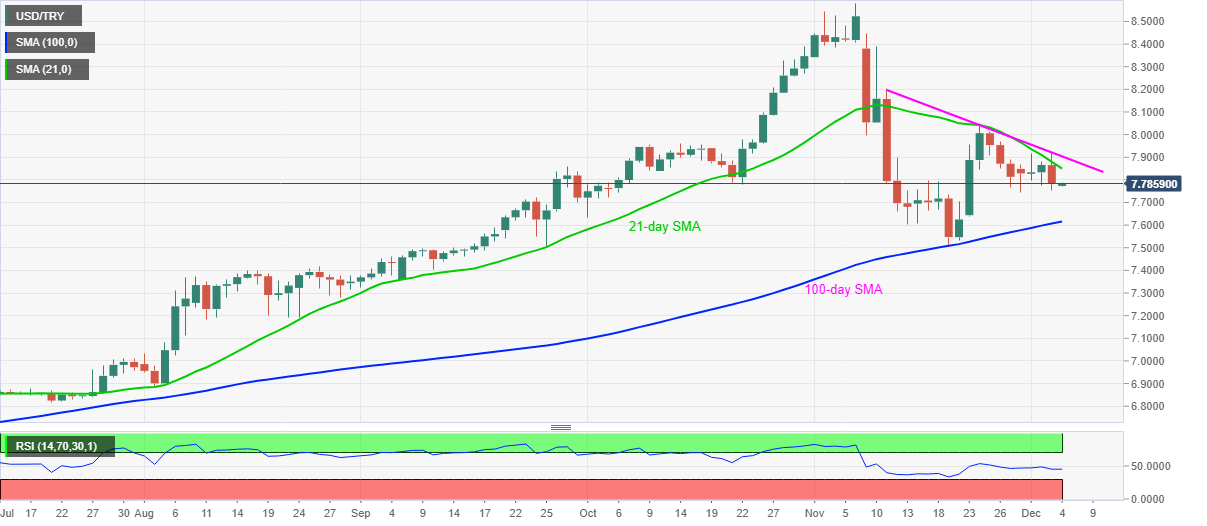
Trend: Bearish
Author

Anil Panchal
FXStreet
Anil Panchal has nearly 15 years of experience in tracking financial markets. With a keen interest in macroeconomics, Anil aptly tracks global news/updates and stays well-informed about the global financial moves and their implications.


